A Guide to Toothpastes
Several weeks ago, I injured my foot toe, as walking on crutches is truly tiring, I spent most of my spare time in my dormitory, watching my roommates rushing in and out, preparing their day in hurry. A day starts with brushing their teeth and also ends with that, too. They talk with others in that procedure and reflect their day, think and look at themselves in the mirror. And I think, wow, everyone would brush their teeth everyday whatever their age, habit and occupation. Teeth are inside of their mouth, and why would people brush their teeth and how would they choose their toothpaste?
As there seems to have limited kinds of toothpaste and people have preference for everything, how would they quickly find the best matching toothpaste?

How do I get my data
My starting point is just the topic Toothpaste, I typed the word on Google, and acquiring multiple kinds of related information. Most of them are the official website of the toothpaste companies or some science websites introducing the key ingredients in it. What's most appealing are some on-line communities discussing on the topic. I read a post on ZHIHU, similar with the Quora, sharing opinions on a proposed question, one asked what would you do while brushing your teeth. Answers show that what people do during the process are quite similar, and surely strongly related with the aim of brushing their teeth, e.g. becoming more beautiful or making themselves feel more confident. People also actively recommending toothpaste to the others, mainly focusing on the unique tastes, effects and unfamiliar brands.
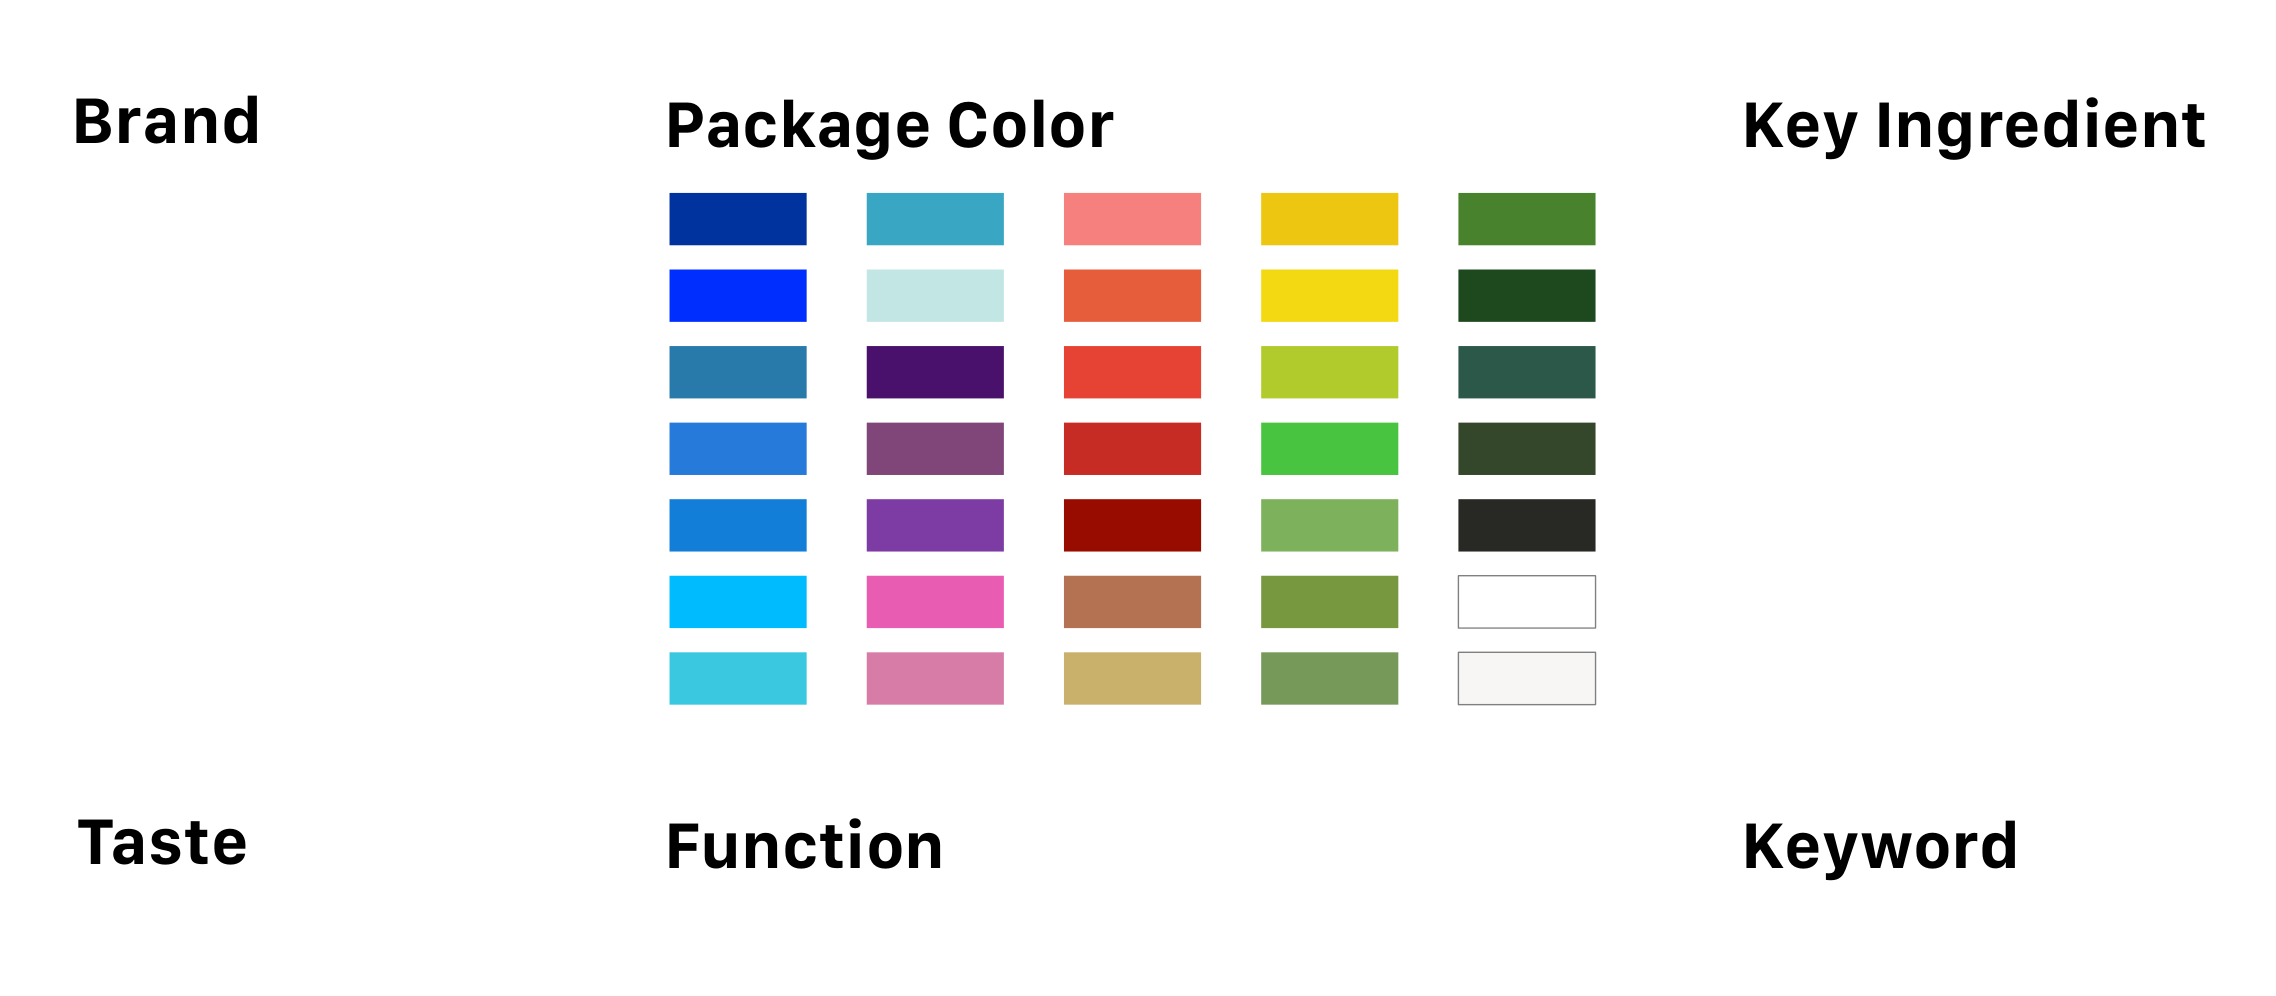
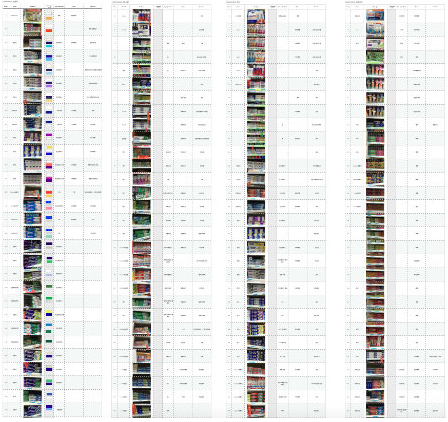
However, the detailed toothpaste information cannot be acquired through the Internet, so I paid a visit to several supermarkets and took photos for every toothpaste I got. The highlighted or enlarged words on the toothpaste enlightened me the potential answers to why would people brush their tooth, as shown in Fig.2. In two days, I collect around 206 kinds of toothpaste, then deleted some niche products and left 167 popular toothpastes on market. A draft dataset is created, as shown in Fig.3, columns includes brand, package color, key ingredient, taste, function and key word.

OK, now time for some boring work
Filling in my dataset is really time-consuming, also boring, after all these hard work, I think I can conclude some guidelines for data arranging and analyzing. First, you should have a clear motivation, and only do what is necessary. In the process, we have to make multiple decisions just to filter and filter, and motivation would provide the answer. My motivation is getting the answer how people choose their toothpaste. When choosing their toothpaste, people are always attracted by the package color of the toothpaste, but actually what they cares are the functions of the toothpaste also the contents in it. So related data types are needed. Second, never wait till all the data is done, we should make some small attempts occasionally. I filled the columns of first 30 toothpastes and then reduce the number of the columns. As I work individually, I spent most of my time arranging the data I needed or can be further explored, the updated dataset is shown in Fig. 4. To make my work more efficient, I also get assistance from several programs (attached in the end) to collect color from the photos I took. Programs can help to taking out five to twenty or even more colors in the picture, I collect only the main colors of the package, mainly form one to four, which bring customers the first impression. Based on the key ingredients, tastes functions and the key words on the package, I categorized all the toothpastes into four groups, named (Whiten & Beautify)(Anti Sensitive) (Anti Tooth-decay & Gum Protection) and (Refresh & Fruity).

Tools to Extract Colors
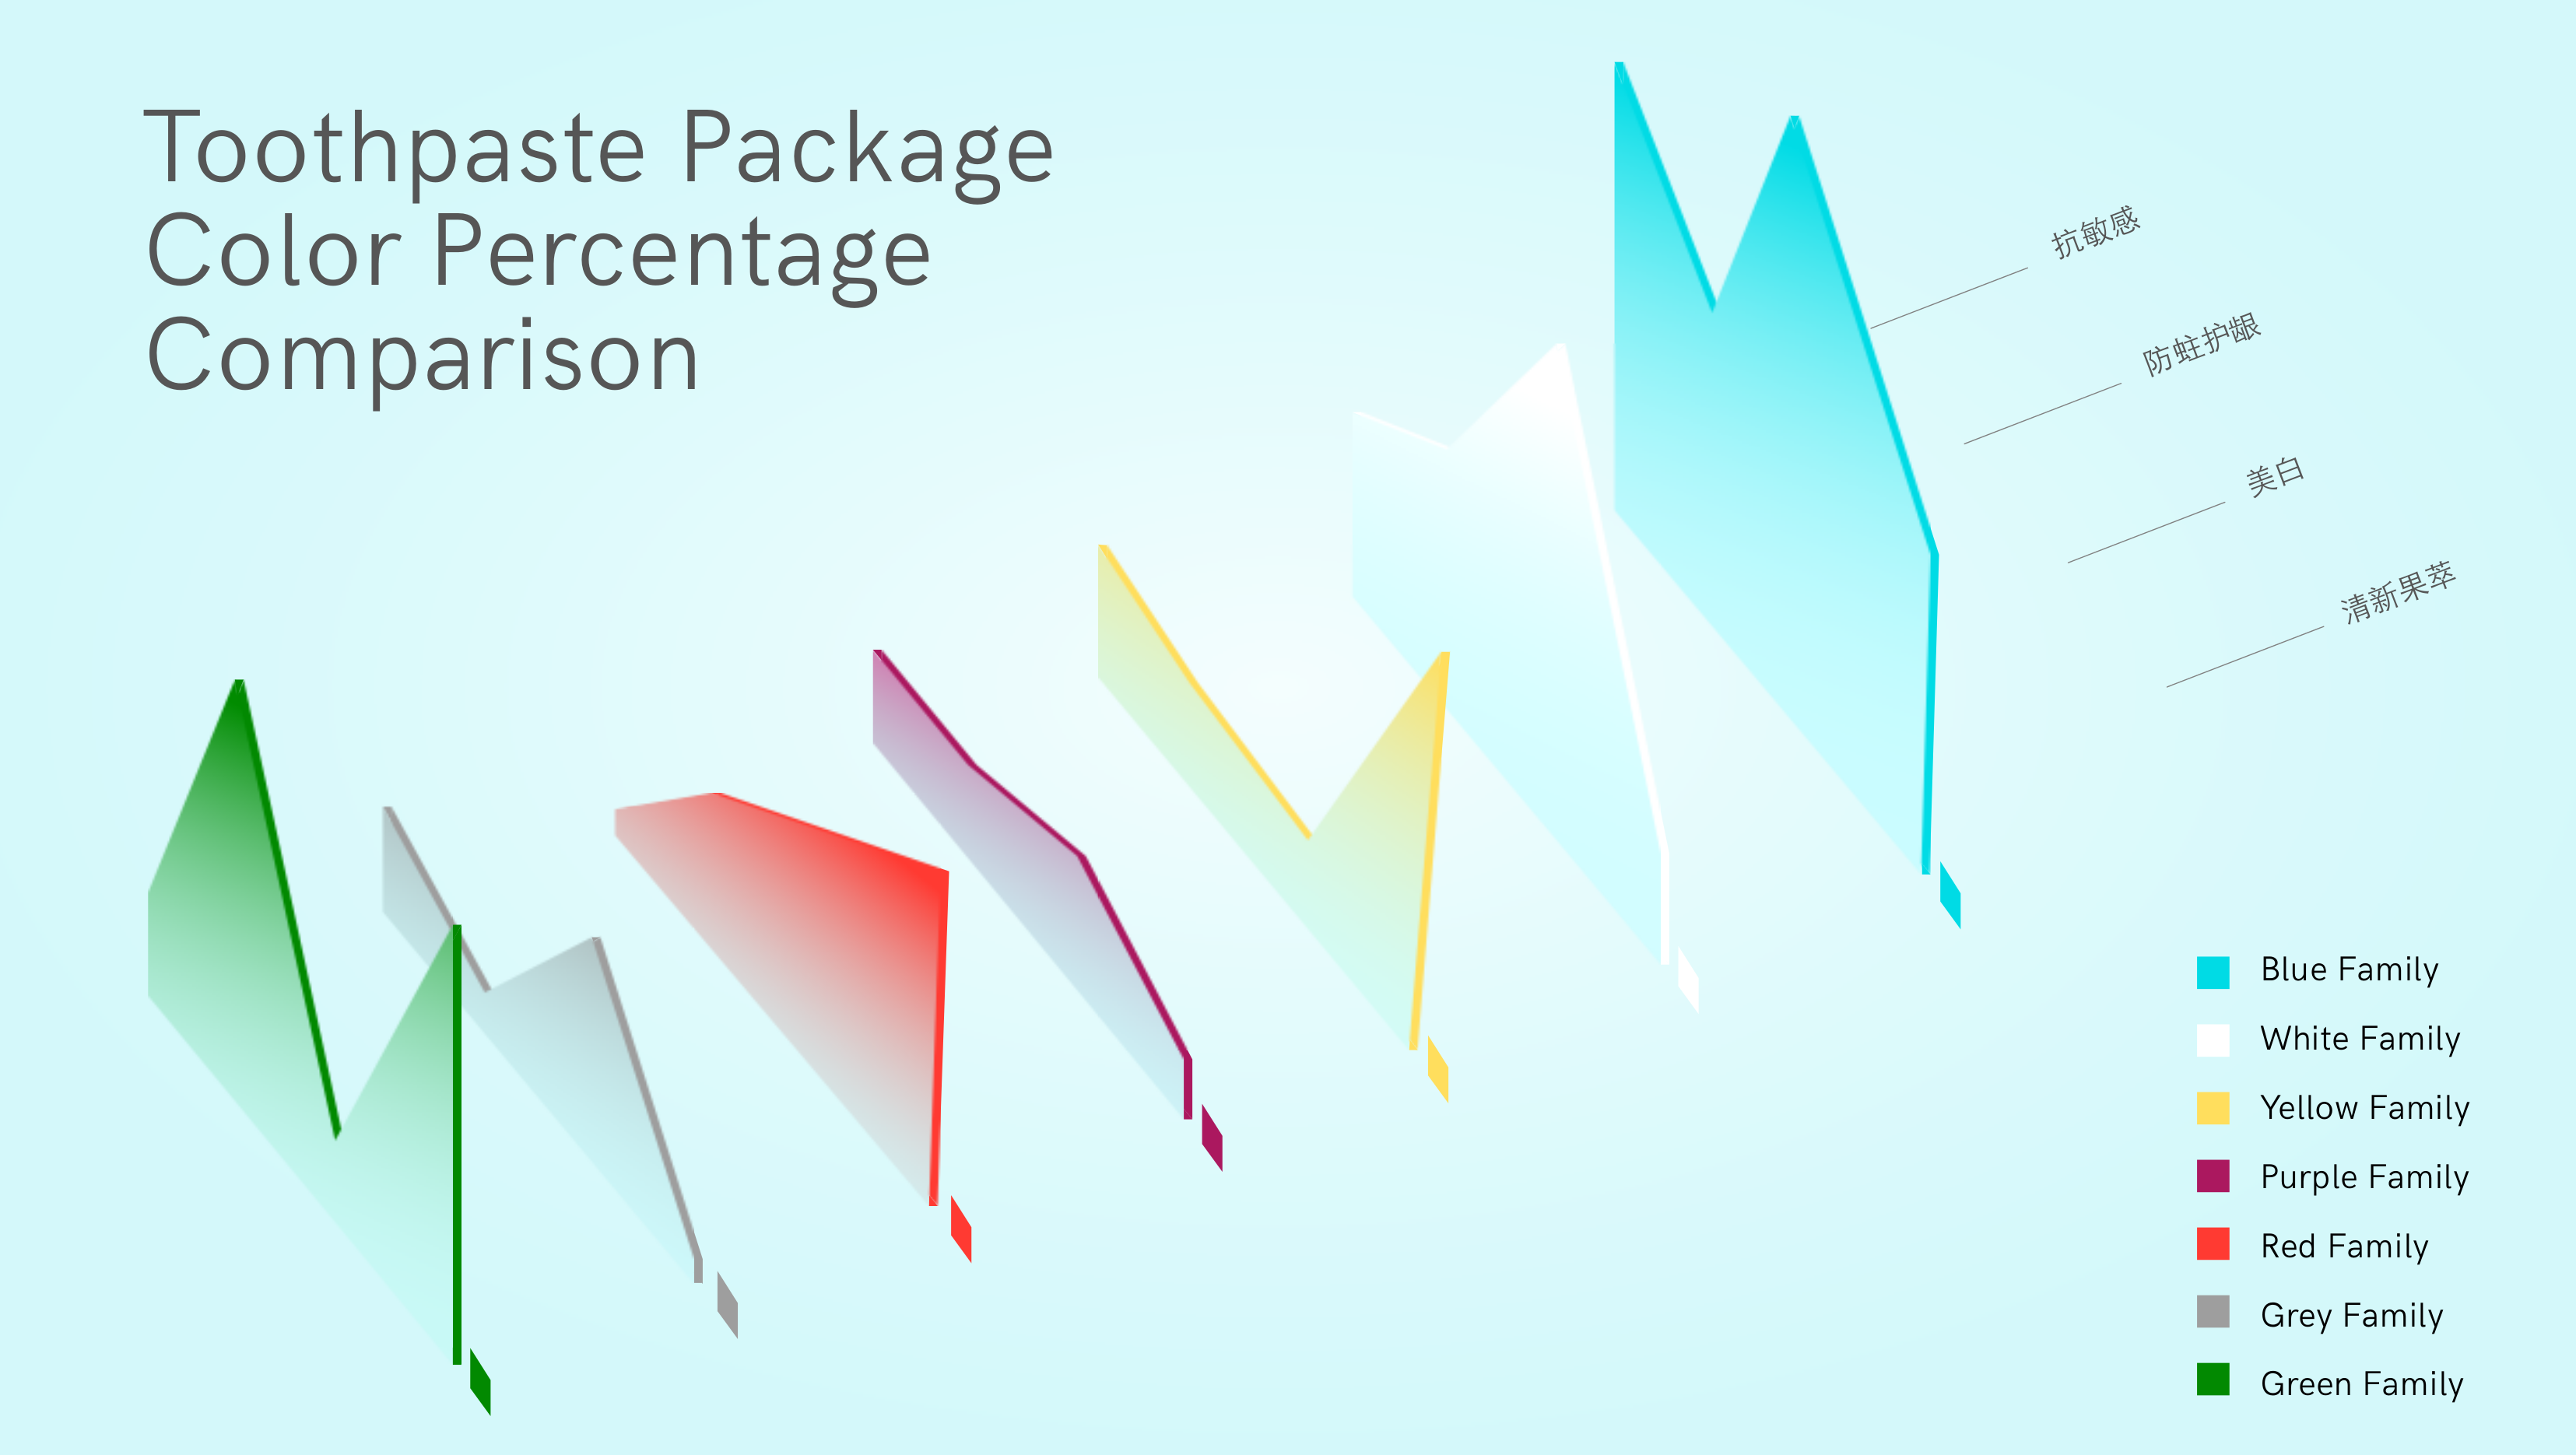
Now I got in hand a simplified edition of dataset, and the visualization should show the relations in between obviously. After collecting all the colors, I arranged them by the color hue property. Each group of toothpaste owns seven color columns, red column, blue column, green column, yellow column, purple column, grey column and white column. Then the sequence of the colors is decided by the lightness and saturation of the colors, shown in Fig.6,a clear difference can be found. Toothpaste of different functions have preference for a certain category of color, and it is also connected with the toothpaste brand’s unique identity color, as brands all have their specialities. The different percentages colors take in different toothpaste groups indicates the link between the package colors and the functions or key features of toothpaste. Finding correct way to visualize. all these requires attempts of multiple classic ways. I also tried to find some inspirations from some graphic designs. So this process can be called play with the data, and most of the time, I am exploring.
The customers are always attracted by the package of the toothpaste, but they need to know the contents
inside also the function of the toothpastes. I use the width of different color lines to represent the
percentage inside. And it can be easily noticed the differences.
Continue to read the full datastory in pdf
Previews from the visualizations (click for full view)

Sources
download the full datastory in pdf + website version Project by LI Tong
back to top