Cocktails Wheel
On github you-ll find a full online version of the datastory [ pdf link 1 || link 2] + sourcecode, JSON dataset, screencasts, and the link to download the beta app.
The reason we chose to dig into cocktails is that we share same interests in synesthesia. We would like to provide those who doesn't seem to know cocktails pretty much a well designed guidance to interact with. During the process of research we gained better understanding about Data Visualization, how to discover underlying patterns out of data and graphs like a pro, as well as how to organize our data story in reasonable ways.
The long story short
THE RAW DATA We scrap the ingredients data of 72 cocktails from wiki.webtender.com, as well as the flavor distribution data of 48 cocktails from yummly.com, and then we intersect these two sets of data, consequently we got a dataset contains 48 cocktails with full records of ingredients and flavor.
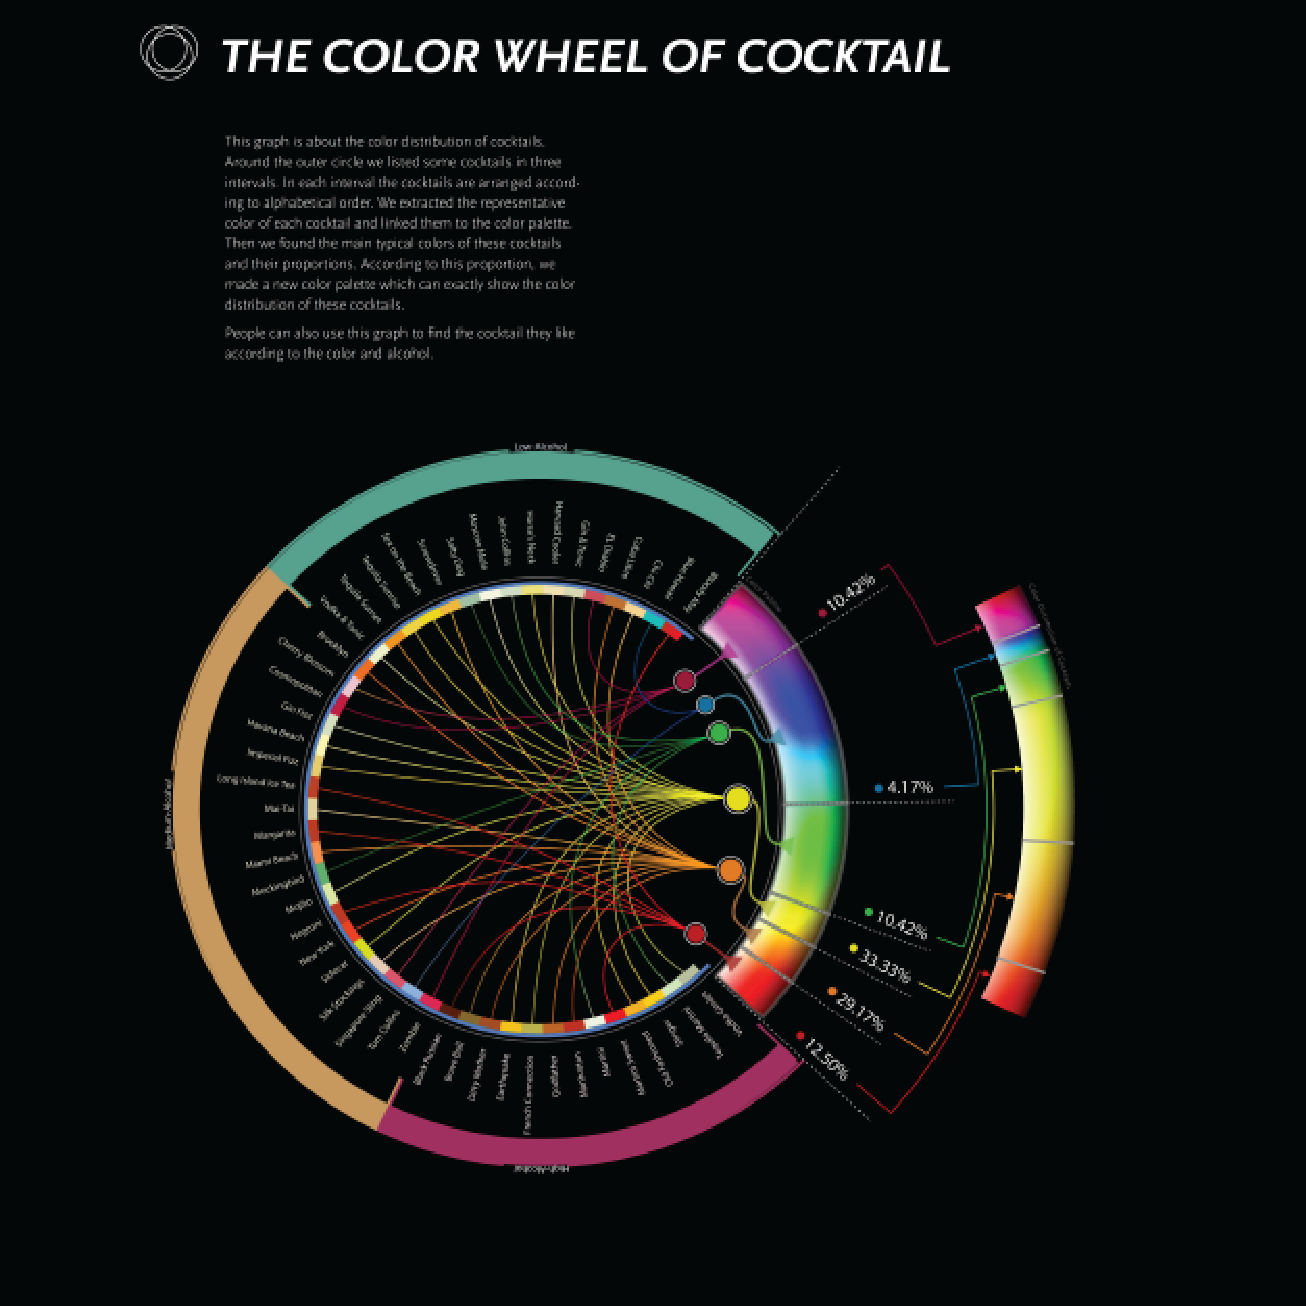
THE COLOR WHEEL We collect a set of images based on the origin data set of 48 cocktails, and then we use Abode Color CC to extract colors out of it. We mapping those color on the chromatogram which demonstrates the color distribution of cocktails, as well as the regions of color that appear to be the common appearance of cocktails.
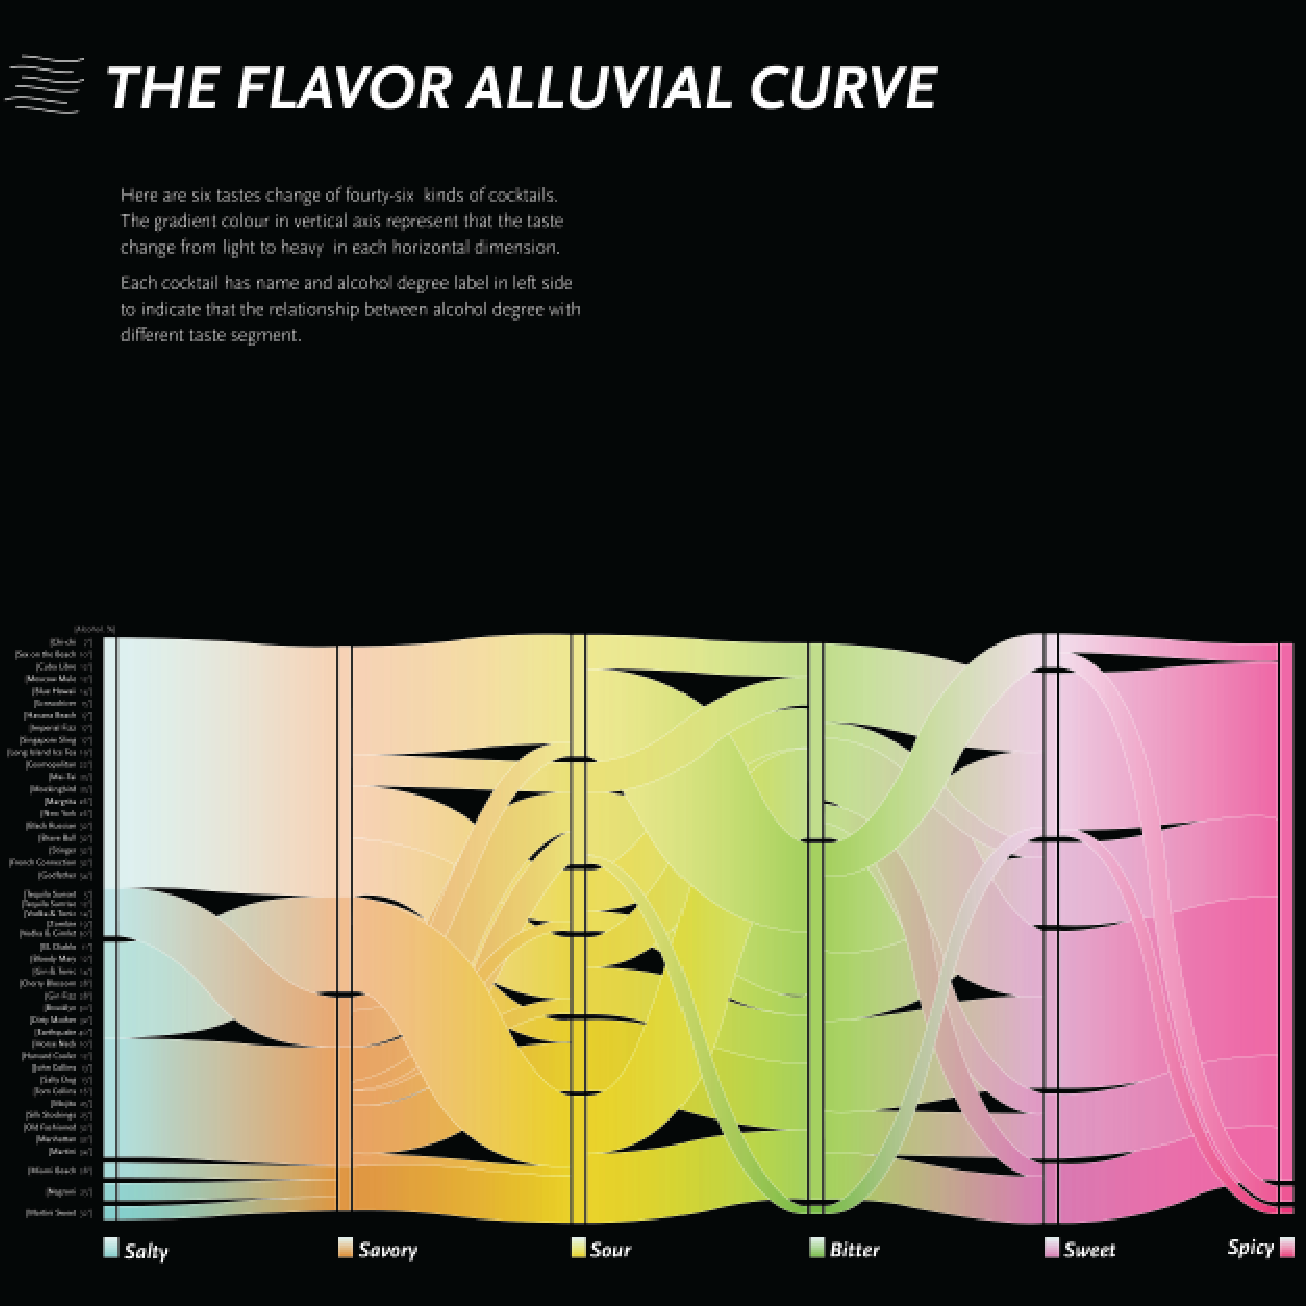
THE FLAVOR MAP After we generated the csv file, we draw several initial alluvial graphs with RAW, among which we select the one that indicates the flavor curve in between six dimensions(salty, savory, sour, bitter, sweet and spicy) to dig in to.
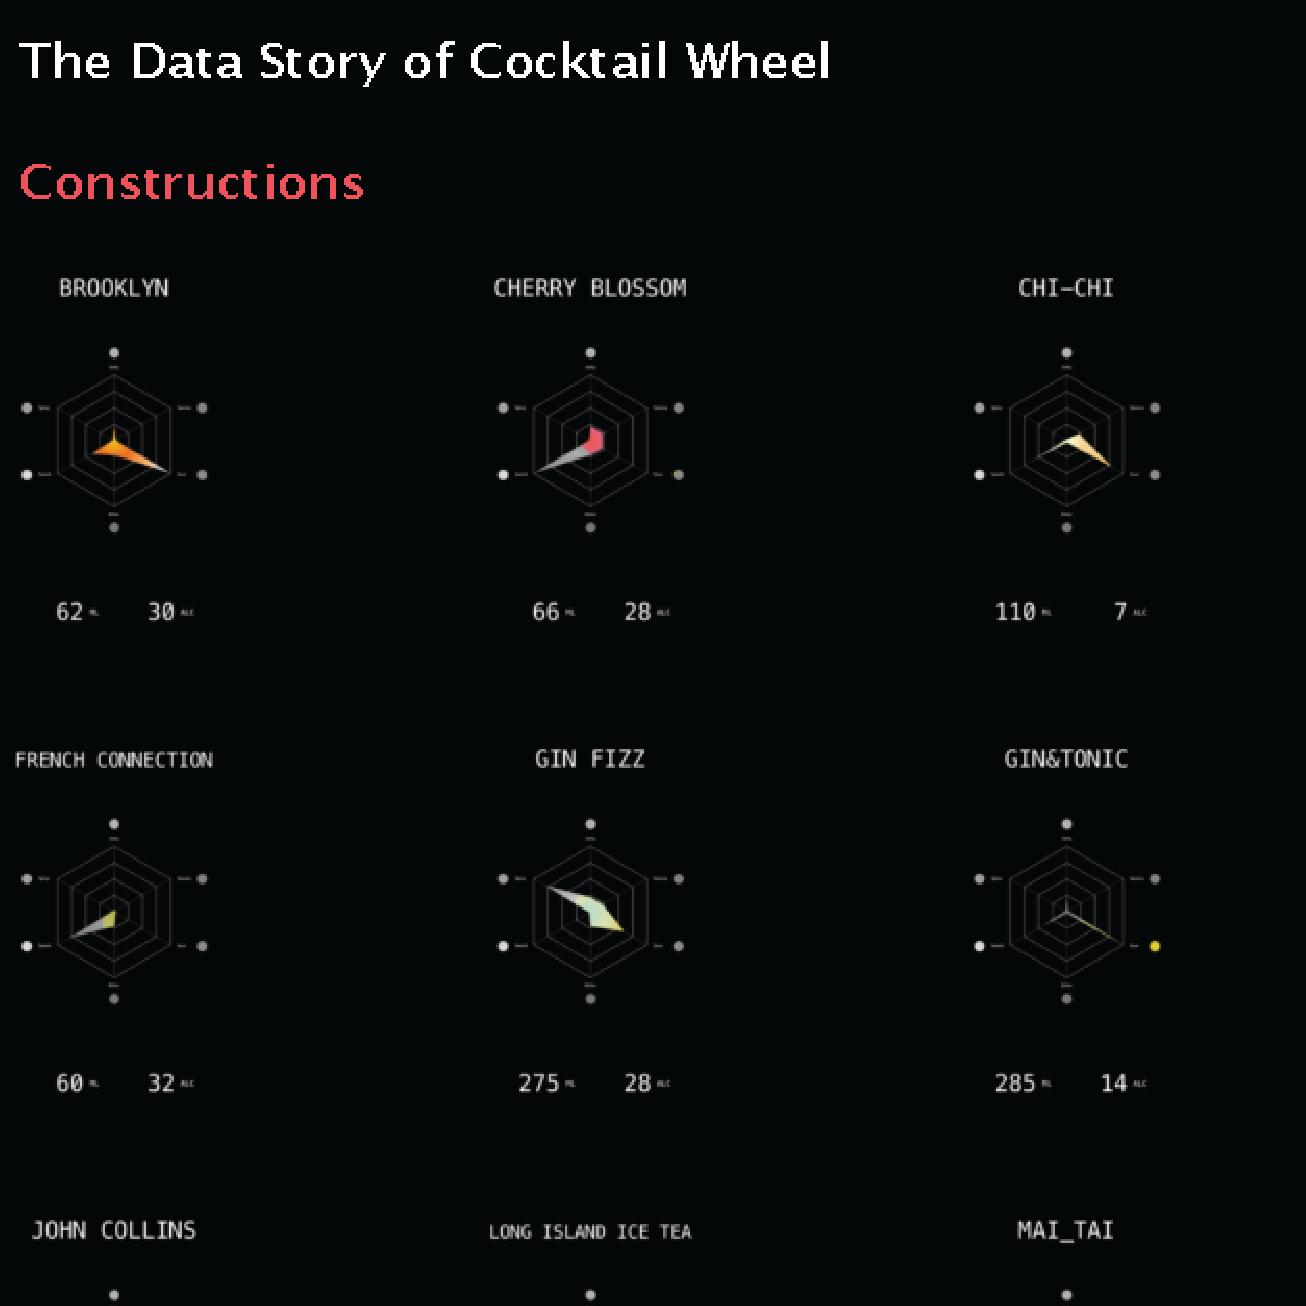
THE DYNAMIC VISUALS OF FLAVOR We draw the flavor radar map of 48 cocktails with code, after which we design a visual structure based on the five layers of ingredients(spirit wine, liquor wine, juice, soda and spice) and six different kinds of flavors as mentioned before, of each one of cocktail in the data set. We finally developed an app which integrates our design and our data altogether.
Experiencing the visual and the flow of taste, in your pocket Based the database we set up, we eventually developed an app on iOS, which demonstrates the taste, the appearances and the ingredients of different cocktails in a visual, dynamic way. After weeks of data manipulation and coding, we successfully made a desirable output through several rounds of iteration. Here the story from the very beginning.
How Do We Get Data
We started from several publications about cocktails as our main data source. However, after we found it hard to transfer the format from printed labels into digital bytes, we decided to change our target to online sources such as websites and forums. Chances are we are able to find reliable data sources which are frequently maintained or put it in another way, not quite out of date yet. Since some of the forums and sites are really old-fashioned & outmoded.  Fortunately enough we discovered these following sites. Webtender is a wiki system whose bartending resource is there for the benefit of all cocktail, bartending enthusiasts, regardless of experience, or supposed expertise. This wiki contains verified facts, recipes, citations, with which the past "truths" of bartending can be dispelled or corroborated.
Yummly.com was launched in 2010 by foodies on a mission to invent the ultimate kitchen tool. Whether it’s finding a recipe or going to the store. Yummly wants to make it easier for foodies to do what they love – cook, eat, and share. We discover the import.io in the second week, it is a rapid online web tools for you to scrap data from web pages with just an url, moreover there is no need to write a single line of code when you are using it.
From webtender we scrap datas related with ingredients and receipts of 72 different kinds of cocktails. The raw data on webtender is hypertext, based on which we converted into .csv using import.io. Eventually we got a .csv file with columns listed as follow From Yummly we scrap datas related with flavours of six dimensions of 48 different kinds of cocktails. We were using the same approach to crawl data from pages on yummly.com. Consequently we got another .csv file with column listed as follow. Finished generating those two sets of data, we made an intersection since they share the same property of ‘Name’. So we came out with a data set contains 48 cocktails with full records of ingredients and flavor in the first stage of data gaining.
Colors as an essential element of cocktails cannot be ignored. We collect a set of images based on the origin data set of 48 cocktails, and then we use Abode Color CC to extract colors out of it.
Based on the previous extractions of colors among 48 cocktails, we further extract the most essential color of each cocktails for subsequent usage in the next step.
The Analysis and Play Arounds
 The tools Numbers, Tableau, and RAW are the three essential softwares as the data analyzation toolkit that we used in the intermediate step, which is the analysis and play arouds of the data. The problem that we occured as data researchers was that our dataset was relatively simple and straight forward, which means that all of our relations of data came directly from websites that someone already summerized for us, yet we never came to run through surveys or researches that engage with people. For that we need to dig into what we have and uncover certain underlying patterns, which could regards to ingredients, flavors and appearances. After generating the initial graph out of the raw data, we begun to stack multiple layers of graphical content together, by doing which there already shows several retionals like, among cocktails with high degrees of alcohol the amount of ingredients, except for spirit wine, had reduce significantly.
In the full datastory you find more example of stacked graphics. We took into the perspective of categories of spirit wine. The first graph is the area map we generated directly from data with Numbers, then we stacked another layer that represents six sections of spirit wine, Gin, Vodka, Rum, Tequila, Whiskey and Brandy. The trends become obvious after we combined the layers altogether, for instance, the amount of juice that bartenders put into cocktails based in Vodka is way beyond other categories of spirit wine. The above graphs was made with Numbers and the Sketch app. They show general patterns regards to ingredients of cocktails corresponding to our perspectives of looking the data, from spirit wines to the degree of alcohols, which we consider, however, is far away from satisfying. We then decided to extent our analysis which means merging the data of flavors with ingredients together.
Still, we divided cocktails into six categories based on different sprite wines, yet this time we did something related with six dimensions of flavours. In the above stacked area map, the trends of each cocktail family is unique, the brandy family is sweet, the gin family shows a rich variety in different flavours, the rum family is either sweet or sour, the taste of cocktails in the vodka family is relatively the mildest (for the smallest amount of area in total) which on the contrary shows in an opposite way in the Tequila & Whiskey Family. It would be better to relate flavors with ingredients, there could be possible underlying relations although our volume of data wasn't large enough, yet it still worth trying.  However, to be honestly here, we were a little bit frustrated and disappointed about what we had when we arrived to this stage, cause there was no such evidence that indicates the relation between ingredients and flavours clear enough as we expected in the first way. We then rethink the whole process and came out with the following conclusion. First of all, the data of ingredients and the data of flavours came from two different sites, so it is not odd to see there weren't so much similarities, not mention conflicts. Secondly, the flavour and the taste itself is indeed a significantly complicated issue, if we came close to successfully mapping a reliable pattern or formula based on what we have, a dataset of 48 cocktails, that can be the most rediculous thing happend since Donald Trump had announced his presidential campaign. Eventually, we dicided to dig into the flavour of cocktails itself for those who doesn't seem to know cocktails very well, as well as the prospective of color and appearance, and most importantly, a dynamic visual format that absracts the taste, a matter that you couldn't see or touch, into visible content.
We developed the following visualizations - flavor alluvional curve, color wheel of cocktails, construtions, and flavor spectrum - whose details are included in the datastory at pages 16 to 21.


Developing Visualization
So how do we exactly combine ingredients and flavour altogether is the major issue in this stage. Our design can be seperated into two sections, the layer of visuals stands for the ingredients, there are all five layers of graphs, from spirit wine to spice, and the other design aspect is the shape of graphics, each kind of shape represents a specific flavour. Since our dataset determines that each cocktails has a series of ingredients, which form the receipt of it. The dimensions of flavours, on the other hand, varies from one to another at the same time. Before the coding process started, we made an estimation that if everything works fine as we designed, the software we made will generate a unique dynamic visual corelating each one of cocktail in our dataset. They will show a diversity of The frequency of wave, which determined by six dimension of flavours.
Layers, which determined by five type of ingredients. The rate of amplitude, which determined by the degree of alcohol. Gradient Colors, which determined by the color extractions we made in the previous stage.
During the coding process, we developed several formulas regards to different visual elements, following are the major fomulation and their corresponding code snippets.
Layers The transparency of ingredient layers is determined by the amount of ingredients.
baseWineWave.alpha = baseWineAmount == 0 ? 0 : 0.5
The frequency of wave The frequency of wave is determined by six dimension of flavours. Each flavor has its own BASE_VALUE_OF_FREQUENCY, then we calculating the factor using weighted averaging, after which an unique frequenct value will be generated for each cocktail.
var adjustFactorOfSalty : CGFloat = 2
var adjustFactorOfSavory : CGFloat = 0.5
var adjustFactorOfSour : CGFloat = 3
var adjustFactorOfBitter : CGFloat = 4
var adjustFactorOfSweet : CGFloat = 1
var adjustFactorOfSpicy : CGFloat = 5
self.baseWineWave.frequency = 0.2 * (sumOfFactor /
CGFloat(sumOfValue)) * (sumOfFactor / CGFloat(sumOfValue))
The rate of amplitude The frequency of wave The transparency of ingredient layers is determined by the amount of ingredients. The rate of amplitude is determined by the degree of alcohol. We take the median value in between 48 cocktails in our data set as the standard value and then we develop the following formula
self.baseWineWave.amplitudeRate = waveAmpRate *
CGFloat(degreeOfAlcohol) / 28 * CGFloat(degreeOfAlcohol) / 28 *
CGFloat(degreeOfAlcohol) / 28 * CGFloat(degreeOfAlcohol) / 28
More details and formulas in the full datastory pdf pages 22-27. We report below the key-value pairs of the JSON that will allow openly to add new items in the database.
{	"Alcohol" : "5",
"Name" : "Tequila Sunset",
"Category" : "Short",
"Making" : "Blend",
"Base Wine" : "Tequila",
"Base Wine Amount" : "30",
"Liquor" : "-",
"Liquor Amount" : "-",
"Juice" : "Lemon",
"Juice Amount" : "30",
"Spice" : "Sugar",
"Spice Amount" : "5",
"Soda" : "-",
"Soda Amount" : "-",
"Others" : "Ice",
"Taste" : "Mild",
"Type of Glass" : "Champagne Saucer",
"Salty" : "0",
"Savory" : "17",
"Sour" : "83",
"Bitter" : "17",
"Sweet" : "50",
"Spicy" : "0"	}
For god sake we finished developing the app in time. Unfortunately we didnt adjust to fit all screen sizes of mobile devices, so for now we only support the iPhone6'/iPhone 6s plus model with the latest system version of iOS9.1, welcome to download at fir.im/cocktail. We open sourced all the code and data on github.com/Dachang/CocktailViz/tree/master Again, we do appreciate any kind of contribute or collaboration on this project.
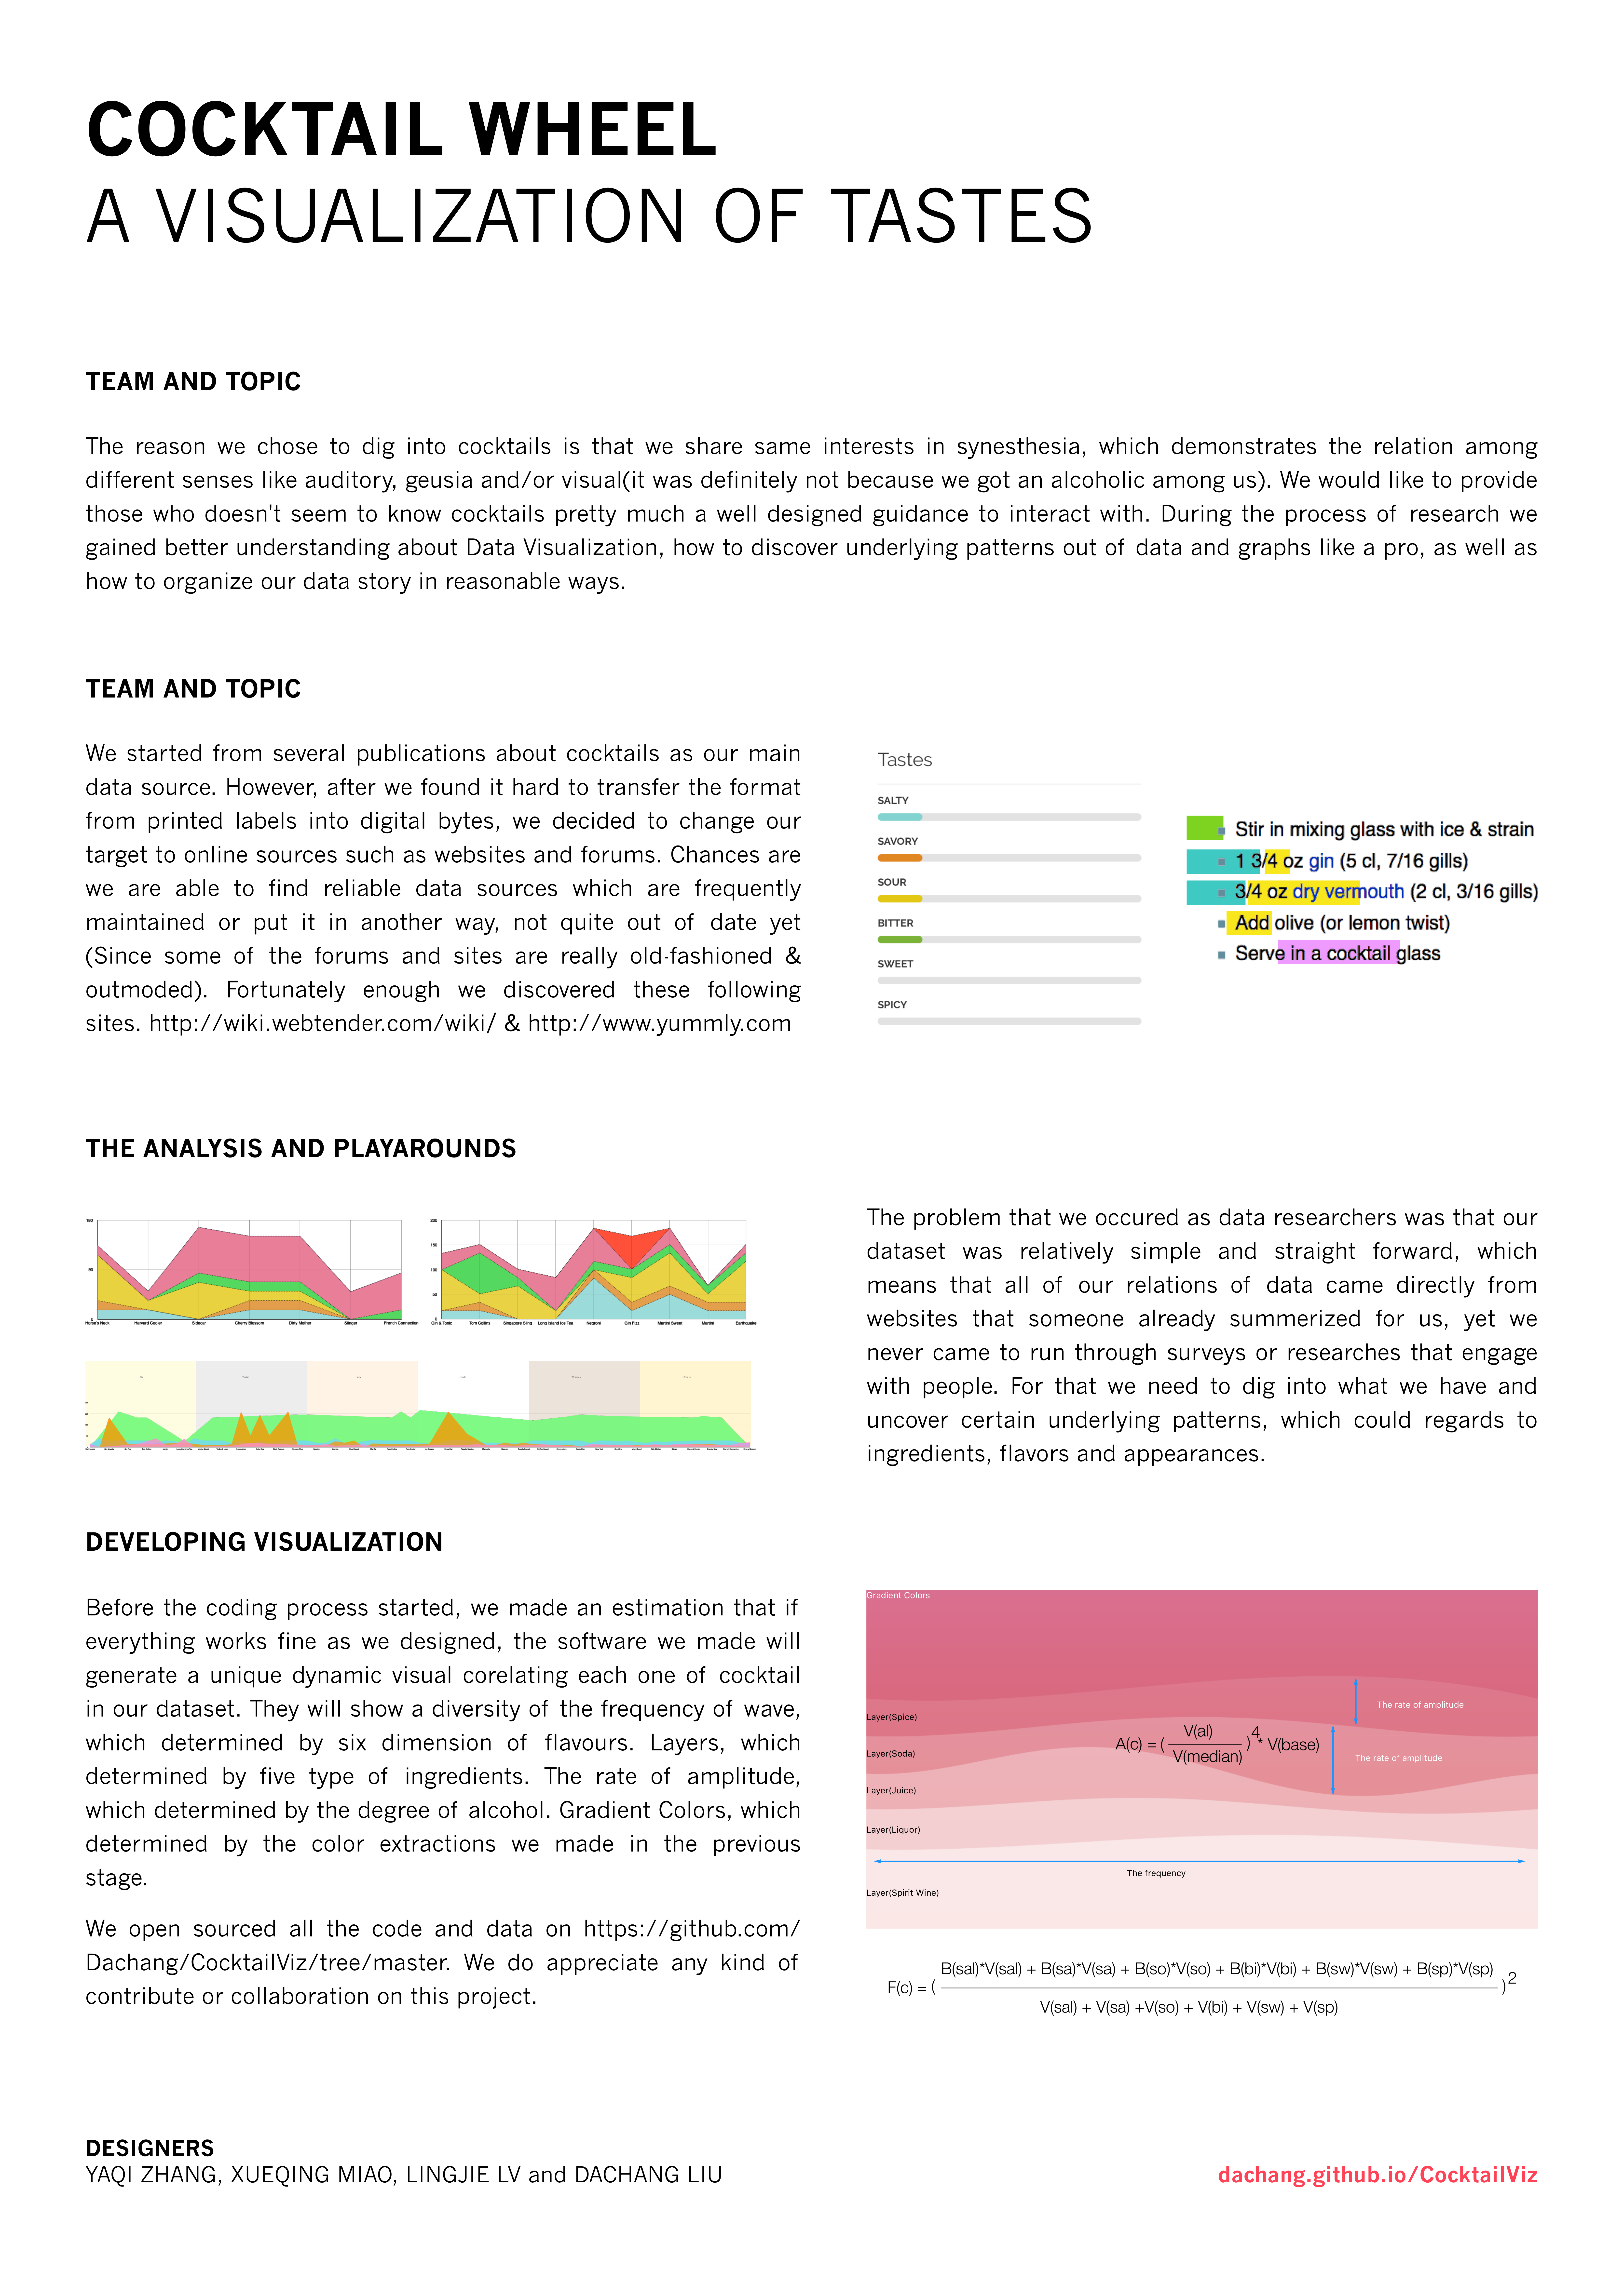
Please check below our final visualizations in poster format


Project by Yaqi Zhang | Xueqing Miao | Lingjie Lv | Dachang Liu
back to top