Beats X Seasons
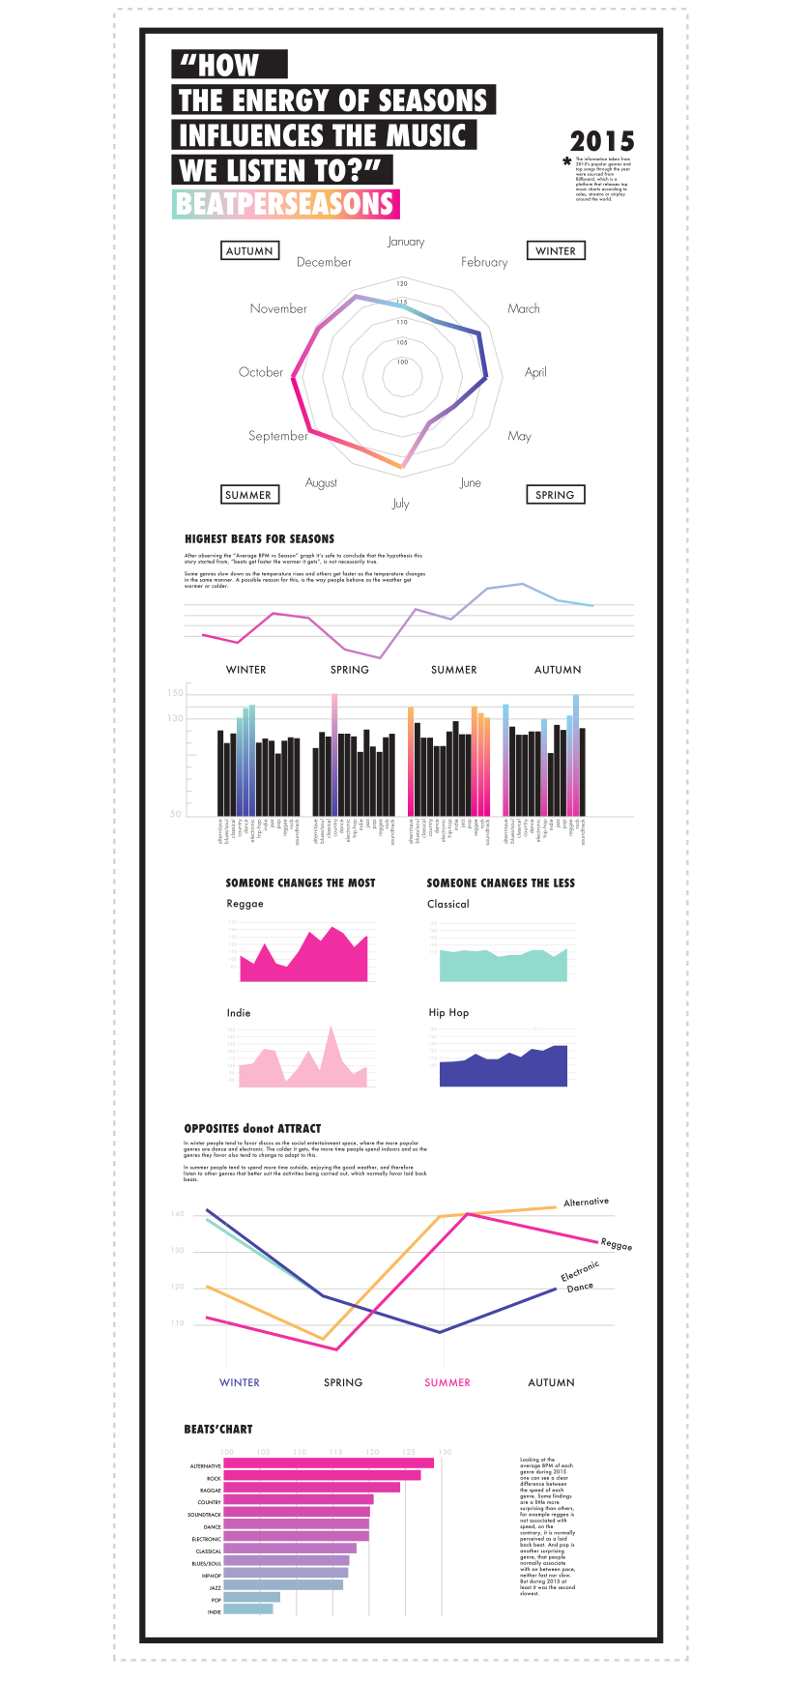
How the energy of seasons influence the music we listen to?
STEP1_ HOW TO CONNECT ENERGY TO A TOOL TO MEASURE MUSIC?
BPM, an universal measurement tool to give an idea of rhythm that works with all genres

The initial question that got this project started was "How does the music we listen to change with the passage of time through different seasons in cycle (year)?". Based on this question, the first problem faced was how to find the common factor in different music genres and compare them to each other. Considering different aspects such as: the key of the song, the rhythm, frequency, instruments, the most flexible and easier aspect to interact with was beat per minute average (BPM) of a song, as it came to be the most relevant. This feature can be used to compare genres, for example classical and electronic. The former, is very conservative genre with stiff and well developed grammatical structure, the latter has a more hands on approach and a very flexible writing structure. Comparing this two extremely different genres would be very difficult using other criteria, because it would require a strong musical background and the result ?would have been very hard to be visualized in a clear and engaging manner.
STEP2_WHAT CONNECTS MUSIC AND SEASON?
PEOPLE are the ones that choose what to listen to

After selecting music and seasons as the main subjects for comparison, each one was deeply analyzed to see what could be relevant to our main question. BPM was selected as the measurement tool, but the link between music and season still was missing. In order to find the possible connections, seasons were broken down into pieces. Seasons are composed of emotions, moods, weather, feelings, atmosphere, activities, colors and images.
After doing this analysis we came up with a plot element; the link between music and seasons are people. People are the ones who listen to music and at the same time are influenced by the season's mood and general atmosphere.
At this point one problem revealed itself: the definition of seasons. Seasons are not the same around the world, they flip depending if they are above or under the equator. There are some places on earth where there's no real distinction between different seasons, and it's not possible to divide them according to rainy and dry periods of the year. Time and seasons are human constructions.
Therefore to simplify the framework, the seasons were chosen as subdivisions . Amongst them the criteria for the selection criteria we chose the seasons that really changed through time (in term of temperatures, weather). This selection led us to visualize the atmospheric features and different "energies" changing. From this concept of season we then moved to analyse only the northern hemisphere, that we took as the final reference point.
STEP3_

We built a tool named "Charts for most played music" by looking at the charts from Billboard.com, gathering data from specific days of each month. (MONTHS/SEASONS). We chose Billboard as it is the most attendible platform for music charts, and it updates its information on weekly basis and also takes contemporary music streaming services into account. People choose the music they hear depending on the season, in a very similar way to how they also choose their outfits depending on the season. To prove this hypothesis, a trustworthy data source was needed. Billboard was chosen as our main and only data source, because of their broad user base and long-standing history as the most popular option for commercial music and also because they take contemporary streaming services into account.
STEP4_CHANNELS AND GENRES
2015_CONTEMPORARY AREA AND TRENDS (STREAMING/ONLINE_DIFFERENT)
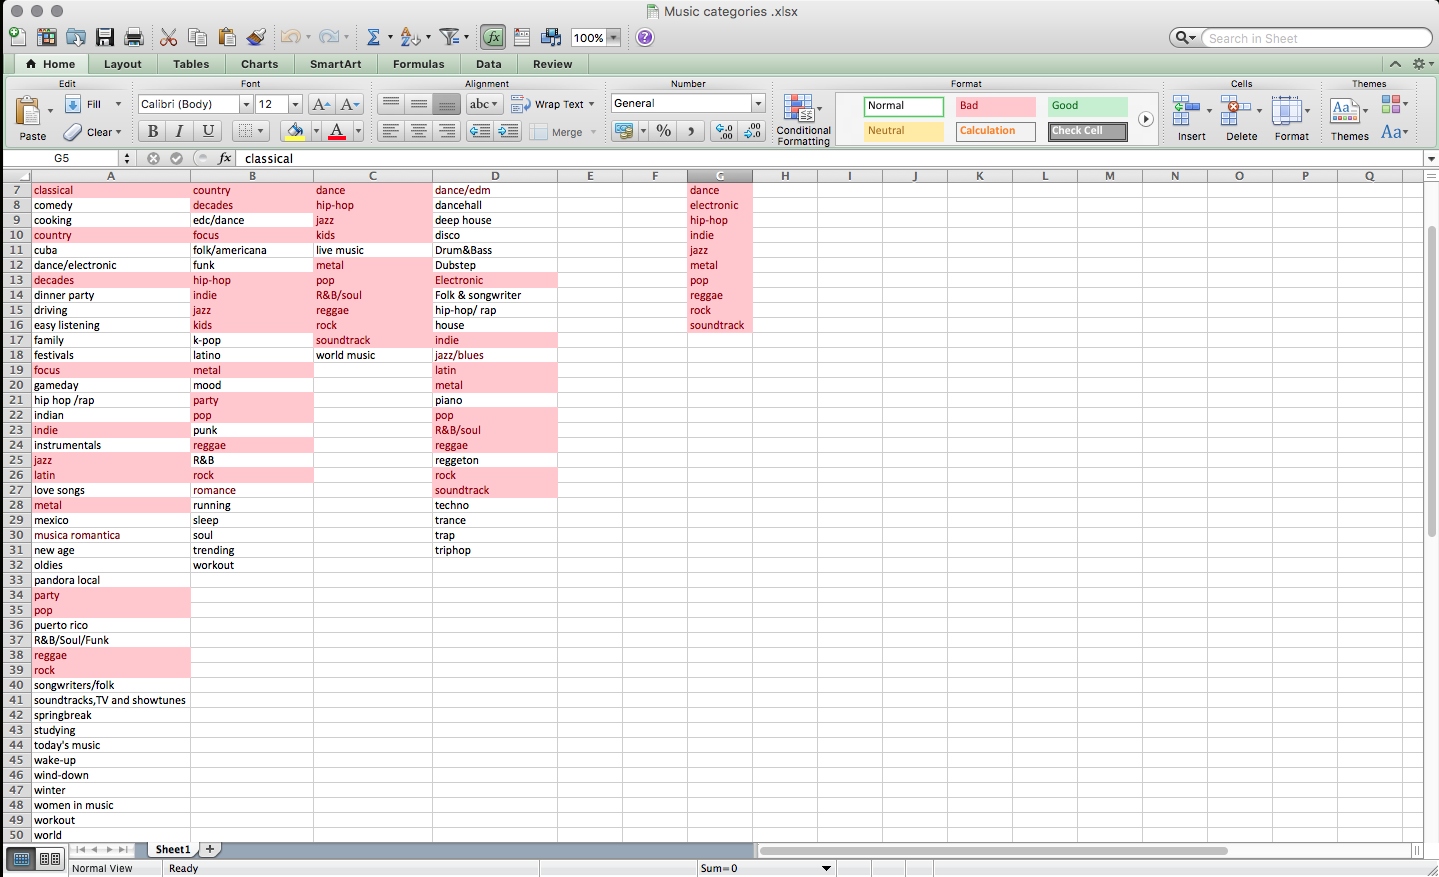
GENRES_(SOUNDCLOUD + SPOTIFY + PANDORA + ITUNES MUSIC)
BILLBOARD_ MOST ATTENDIBLE FOR CHARTS

This visualisation is all about the environment created by the activities, mood, feelings inside the different seasons. The goal is to show how all these elements affect the choices we make related to the kind of music we listen to during these periods. It wasn't possible to base this research on the current year, because we're only half through it. In order to demonstrate what was discovered, it was necessary to analyse the activity during a whole year; 2015 is the best choice because is the the closest year to our current situation. Regarding the music genres chosen to concentrate our research on, we cross-referenced the genres found in most popular music streaming services and picked the ones found in all of them. The information taken from 2015's popular genres and top songs through the year were sourced from Billboard, which is a platform that releases top music charts according to sales, streams or airplay around the world.
STEP5_

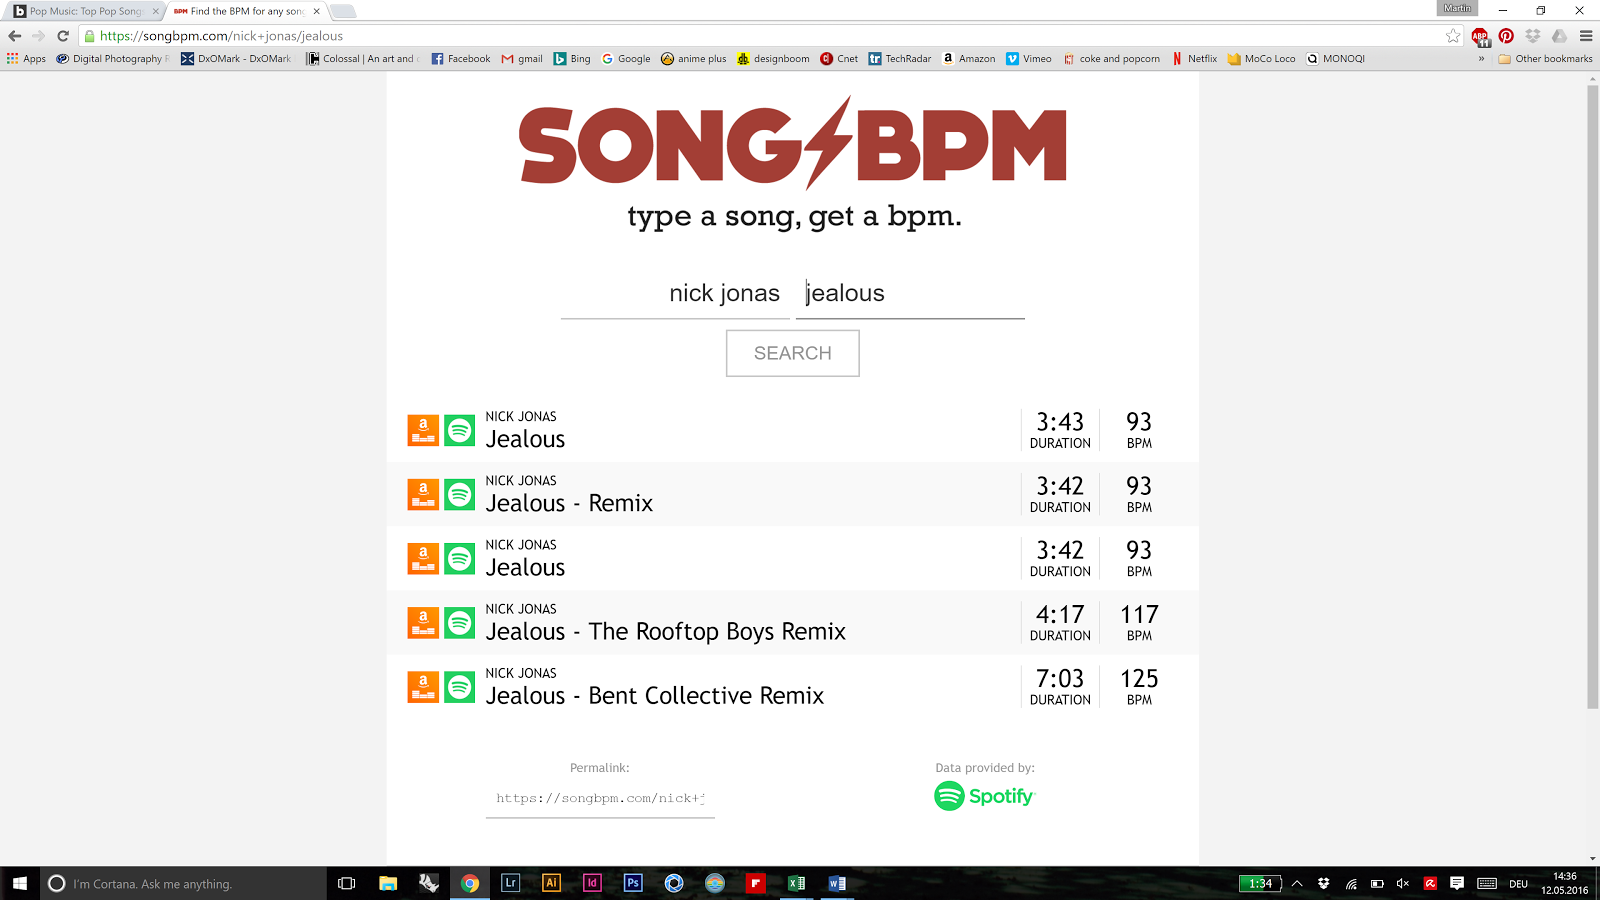
After choosing billboard as the global chart reference point, the issue was how to understand their criteria of publication and data selection. Billboard updates the charts every Monday, trying to complete the weekly updated before 10:00 a.m, but they also give no guarantees the deadline can be reached within the timeframe. Based on this fact the first tuesday of the each month was chosen as the the date on which we collected the information about the top three songs of each genre to compile the database. After the initial compilation, mainly two websites were used to obtain the average BPM of the songs: bpmsong.com and tristankelley.com. Using the bpm of each song in our database it was also possible to calculate the average bpm for each genre per month and genre per season for comparison purposes.
The visualization

Project by Cecilia Picello | Marina Romano Dumas | Martin Holmann Gonzalez | Ottla Arrigoni | Vera Fantinelli
back to top