The Beatles
Looking for connections into sounds - colors - emotions
The main aim of our design visualization research focuses on abstract feelings, starting from the possibility to find concrete connections between two of the most common intangible entities in our life: sounds and colors, in order to see and visualize which their relation is and how this relation can affect our behaviors, and emotions.
Is there any possible theory that can guide us in changing our mood, basing our emotions on how colors and sounds work together? We started pointing out the big connection there is between sounds and colors getting familiar with the concept of synesthesia as the neurological phenomenon in which stimulation of one sensory or cognitive pathway leads to automatic, involuntary experiences in a second sensory or cognitive pathway and more specifically in one of its derivative, the chromostesia.
For people affected by it, colors are triggered when musical notes and/or keys are being played. Moreover, that seemed to be an interesting starting point, at least theoretically. Goethe’s, Harri’s and Newton’s “Color Theories”, that accurately showed how people’s perception of colors could really affect their emotions, so underlying a strong connection between colors and emotions, that could be clearly visualized, even if the studies sometimes connected them using different criteria. What we were still missing was a numerical or at least objective relation between colors and sounds, since the Chromestesia phenomena seemed to be extremely personal in its manifestations.
We made a research on the relation between sounds and colors and how different colors are associated to specific notes. We found many different data sets that matched notes to sounds, and we decided to rely on a sound color correspondence chart from a scientific paper (CHROMOSCALE - Unique Language for Sounds, Colors and Numbers, by Pasquale Di). The chart matches the frequency of each note (for a total of 13 notes) with the wavelength of a color.
At this point of the process, we found out that we had infinitive possibilities of translation and management of the data so we decided to narrow down better our research, squeezing our materials to get to meaningful and more effective solutions. Doing so, we were able to understand that if it is possible to match "easily" with a mathematical calculation colors and sounds, than it is even easier and comprehensible to apply this theory starting directly from notes, since each note has its own frequency, which can be matched to a concrete color. Doing this we understood that we would have been able to "get the mood" of every melody or song: reading the melody's notes, visualizing them using the scientific "color/note match" and so defining the emotions related to it.
However, how to match objectively colors and emotions? Psychologist and Sociologist in history came up with infinitive possibilities of matching colors and emotions, especially based on how people usually react to the light stimuli coming from the experience of particular colors (considering for example the Chromotherapy). We were actually looking for the most objective and simple distinction on how an emotion can be visually defined. The best and most effective solution was then to consider the characters of the Disney movie "Inside-Out", one of the biggest Disney's success of the last year. They are emotions, they are five Angry, Joy, Sad, Fear and Disgust and the color scale associated to each of them is actually able to identify their personality. So, having five emotions to start with gave us the possibility to have five starting colors associated to them, so how to match the twelve notes' colors to five emotions' colors? We moved on the idea of the gradient, not associating to each emotion just one defined color, but instead a gradient in which the emotion is chromatically defined. In addition, it actually makes sense, since emotions are not stable feelings, so we can better define different "states" of them, based on quantity or intensity. This theory found its anchor in a research conducted by Drs. Paul and Eve Ekman together with the Dalai Lama, few years ago, in the project called Atlas of Emotions, where each emotion has different states and where the path through all the states is visually defined using color scales based on a main one (that generally define the "big" emotion). They took in consideration the same emotions we took, using so the same color matching, revealing so perfect for the practical continuance of our process.
Visualizing
The research moved on how to visualize the connection between them, finding some concrete, sensitive data to work with. Finally, comparing some studies coming from psychologists, scientists and musicians we were able to match tangibly this relation, based on the calculation of the music frequencies and the color wavelengths. This one can be considered as a big milestone in our entire process, since wavelengths and frequencies are mathematically connected: the speed of light intact is known and fixed, so reliable number can be generated for the frequencies of the colors through the "Velocity formula". Knowing the wavelength of a certain color, we were able to match it with a sound frequency and match this relation to an emotion or at least to a specter of emotions.

At this point we decided to connect the relation between sounds and colors, with the one between colors and emotions. The reason for which we wanted to do this, was that we wanted to understand the mood of a song, and if the way a song is perceived by people corresponds to what is the actual emotion of the song, considering notes-color-emotions.
Due to the fact that the relation between color and notes is based on a theory which is not approved by any scientific research, we assume our project to be an inspiration for further work, and want to show the possibilities which lay in the connection between sounds and colors. As we are not synesthetic, and did not want to use subjective perceptions, we still hope to give you a basic idea of the concept.
The next questions in our project were: how did we visualize the data? What exact data should we take into consideration, and visualize?
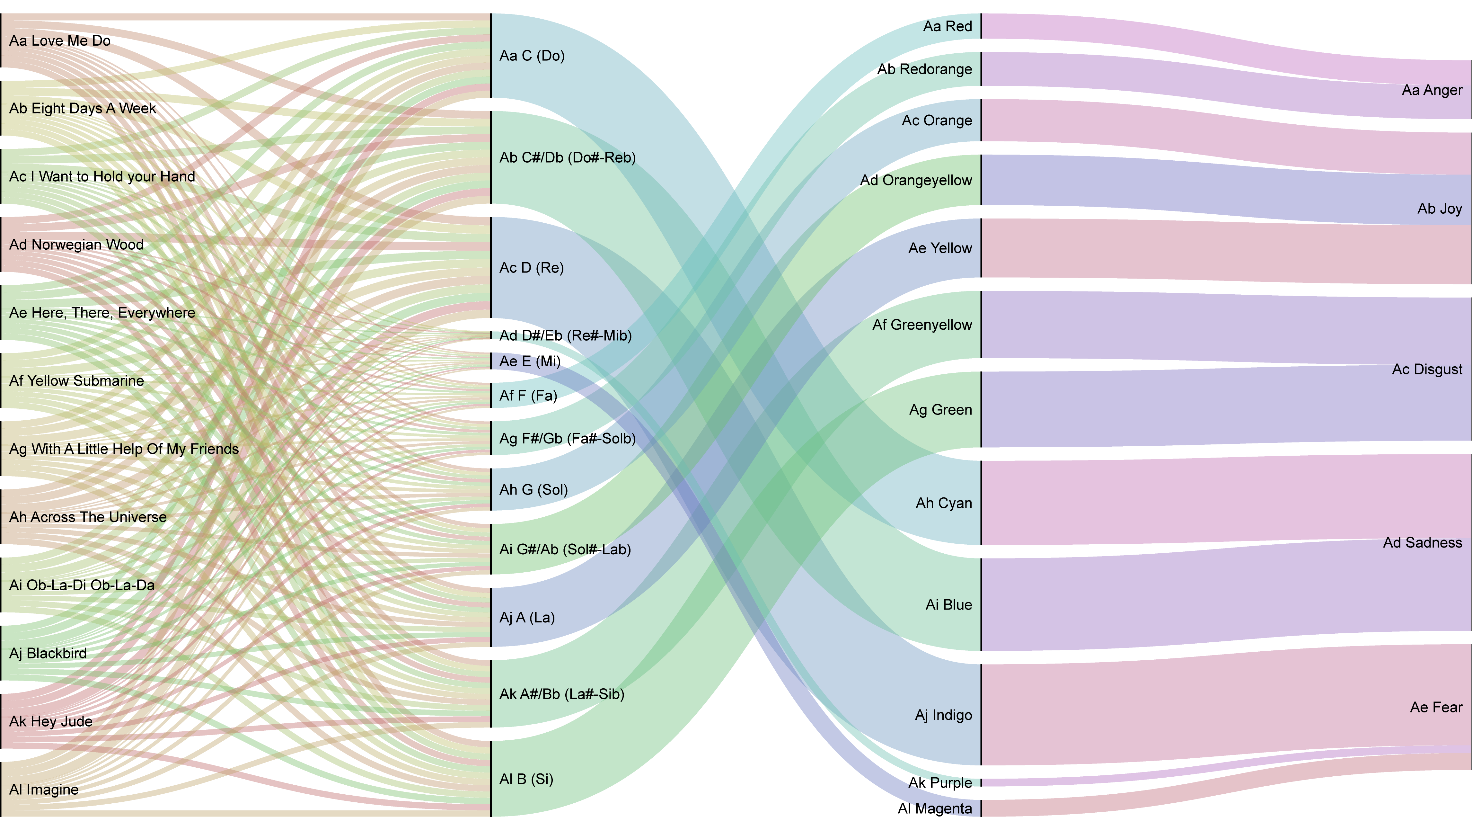
After skectching different solutions, we decided to use the Sankey diagram. We choose this diagram type to show the relation between sound and color, related then to emotions.

It fits perfectly because notes could be displayed on one side, and the main emotions on the other. The connection line between the two is the color.
As we all know The Beatles and their way of expressing emotions in their songs and lifestyle, we wanted to try to apply our concept to this special band. We choose twelve songs from 1963 to 1971, trying to have a fair distribution of the songs in the years, and also according to the availability of scores that we found.
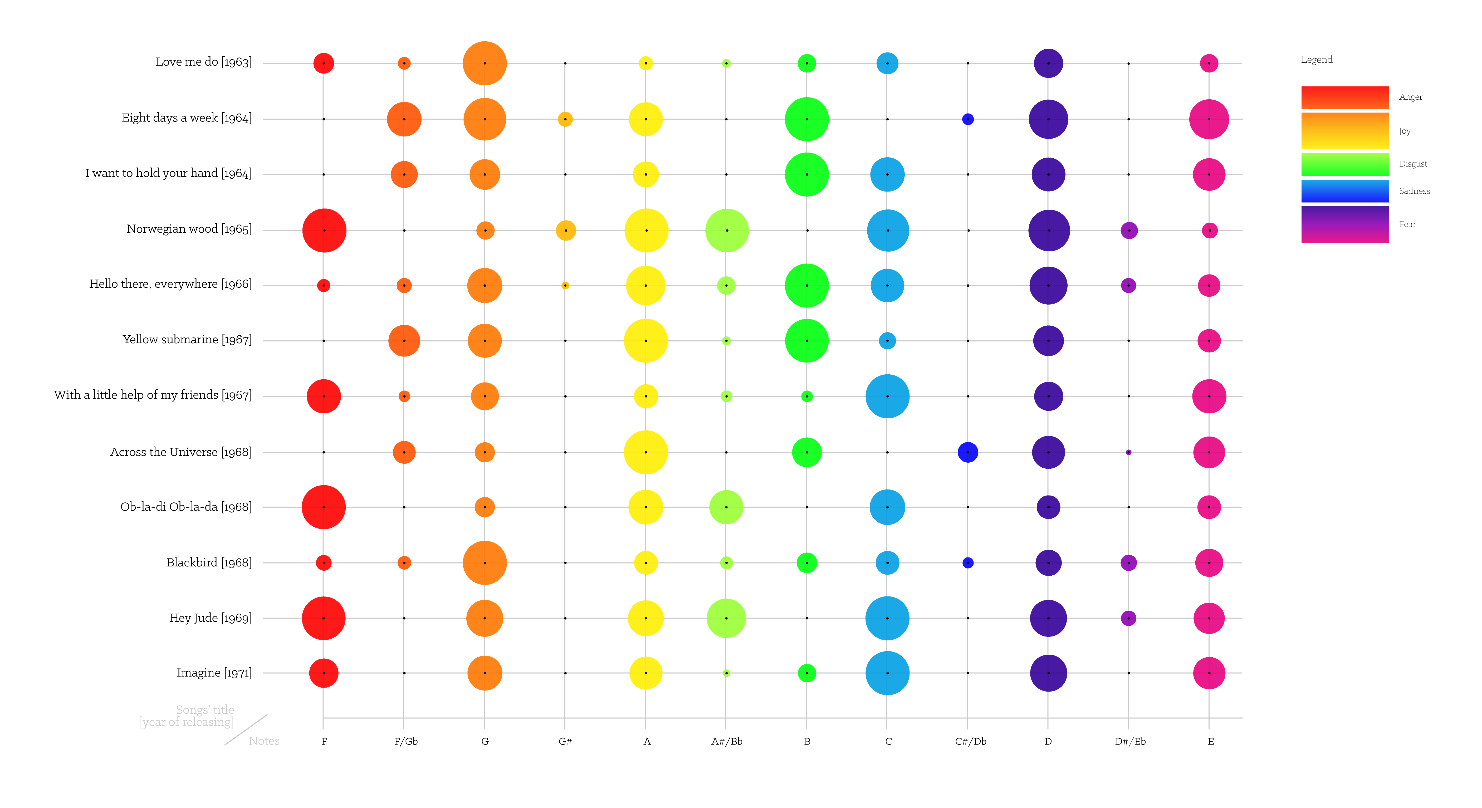
We counted every note from the different melodies (which is easier if you have some music background) and matched the notes to our color system. We know that a D# is never a Eb, but we combined them as one because of their same relation in the lightwave-note system.
This diagram shows our first result of the evolution of mood.
 The bigger the circles, the more often a note was played in the song. The color related to our former emotion-color research.
We had now a complete data set and only needed to conclude all information in one diagram. The Sankey was perfect for this task, and the thickness of the connecting lines helped us to explain the general mood of The Beatles. We ordered the songs by their release date, the notes by the musical gamut and the colors and emotions by the light wave-frequency (rainbow scale).
The diagram
 It was suprising to see how the emotion of the songs differ from the perception that people have of them. For example "Yellow Submarine", which is perceived as a happy song, has a big part of notes that are related to disgust in it, but also a big quantity of notes that represent disgust. Furthermore we were able to understand which are the prevalent emotions, and so the mood, of The Beatles discography (considering the songs we have selected and worked on), which are joy and emotion. It is interesting to see how such contrasting emotions are the main ones in their melodies. Moreover, it was interesting to see how the mood of theirs songs changed in years, from joy, going through anger and disgusts, and ending in sadness.
As conclusion, the method that we developed and used to realize this data visualization can be applied to any existing song, of any artist. What is needed is just the score of the song in order to know the notes that compose the melody, and how many time the different notes are played.
Project by O. Roko Belavic | Giuliano M. Guarini | Alexandra Lunardi
back to top