Online Shoppping in China during 11.11
Online shopping is huge in China. The habit of online shopping seems to just continuously grow. Since online shopping is such an important part in daily life, we decided to focus on the actual numbers of the online shopping habits and deliveries in China, over time, with special concentrate on the Double 11.
full version of the datastory in pdf link
Data Story: project description
Step one: Finding a topic. Initially, topics as delivery, shopping and waste management were discussed, and an idea was to combine these three topics to see relations and to draw conclusions in combination and synthesis
with these areas. An interesting aspect that was discussed already from the beginning is the
change in shopping habits across China, comparing cities by cities or province by province. As
two main ways to look and work with data is either over time, or over geographic locations, the
group agreed on that these were good ways to get familiar with the topic of data management
and visualisation and things we wanted to learn.
Step two: Initial hypothesis and key questions. To get a good basic understanding of the past years shopping habits in China, some basic statistics and data around online shopping was collected and put together.At first, the idea was to
compare the shopping habits and waste, but there was a large challenge to find data around
waste and waste handling in general, so unfortunately this part was removed from the project. Our
key questions was how the online shopping has changes the last years for different provinces in
China, and how these are affected by double 11.
Step three: Find data and building a data set. Initial plan to collect data
The initial idea was to collect as much data as possible around both online shopping, delivery
and waste. The first plan was to find this data for all different provinces in China and over the last
5-10 years, to be able to compare and find interesting connections and insights. We listed the
main actors of online shopping in China, for example: Alibaba, Jingdong, vip.com together with
some others. All team members started to look for data within these areas and started to collect it
into excel files.
Pivoting in topic. Firstly the group started to look for data regarding waste in China and in Chinas provinces. After
many hours of looking and consulting with another teacher at Tongji University, Mary Polites, who
is well-informed and experienced within this area the group decided to pivot and only focus on
online shopping and delivery. The reason behind the decision was mainly since there is no or to
little open data around this subject through out China. So, even if the subject is important and
interesting, it was hard to combine it with the goal of this course; to get familiar with finding, handling
and visualising open data.
Basic data sets. The group decided to also include other data sets, like data around GDP and CPI, to have something
to compare the delivery and shopping data towards, and to potentially find different interesting
insights from this comparisons. This data was collected easily from http://data.stats.gov.cn/english/
easyquery.htm?cn=E0103, https://www.statista.com/statistics/252095/monthly-consumer-
price-index-cpi-in-china-by-region/ and http://data.stats.gov.cn/english/easyquery.htm?
cn=E0101, which all seems as trustworthy websites and sources for data.
Data around online shopping. Data around online shopping from the main actors was collected. Initially, there was a struggle to
get the data and find sources of all data sets we wanted to get a hold of.
We tried to find API of Alibaba, but it is not free or open. So we found the data on “iReaserch”,
which is a professional organisation focusing on the Internet researching. We got the analysed
data from Monitor Report of Online Shopping in China in 2016. Here is the link: Data resource:
http://report.iresearch.cn/report/201702/2945.shtml
Additional data sets. Later we found that maybe GDP and CPI is not accurate compartment and decided to change a
bit. Both these numbers are calculated in a relatively complicated way and does not easily give a
quick understanding and overview for a common audience. We wanted to have something to
compare with that was easy to understand and gave an clear overall understanding and decided
therefor to collect data around around average income, for the different provinces in China. This
information was easily accessible from the website http://www.xuexila.com/zhichang/zhengce/
339360.html.
New key questions and hypothesis. After feeling finished with the data collection, we found that there could be interesting to compare
average income and amount of online shopping, also across provinces that are very different in
their characteristics. For example we wanted to compare traditional industry provinces with provinces
that are poorer and with provinces that are highly developed.
Step four: Analyse the data. After feeling done with the collection it was now time to start with the analysis of the data. As first
steps, we tried out simple graphs, bar charts and circle diagrams inside of Excel to get an understanding
of basic relationships. The main analysis can be read next to the visualisation below.
Step five: Visualise your data
Different tools that were used for initial visualisation. Initially, we used excels build in function just to try out some visualisation types and different charts. We also tried out Infogram, Tablueu Public and Plotly, but decided to finalise our diagrams
in illustrator and Sketch, based on the excel diagrams. You can see all our visualisations below.
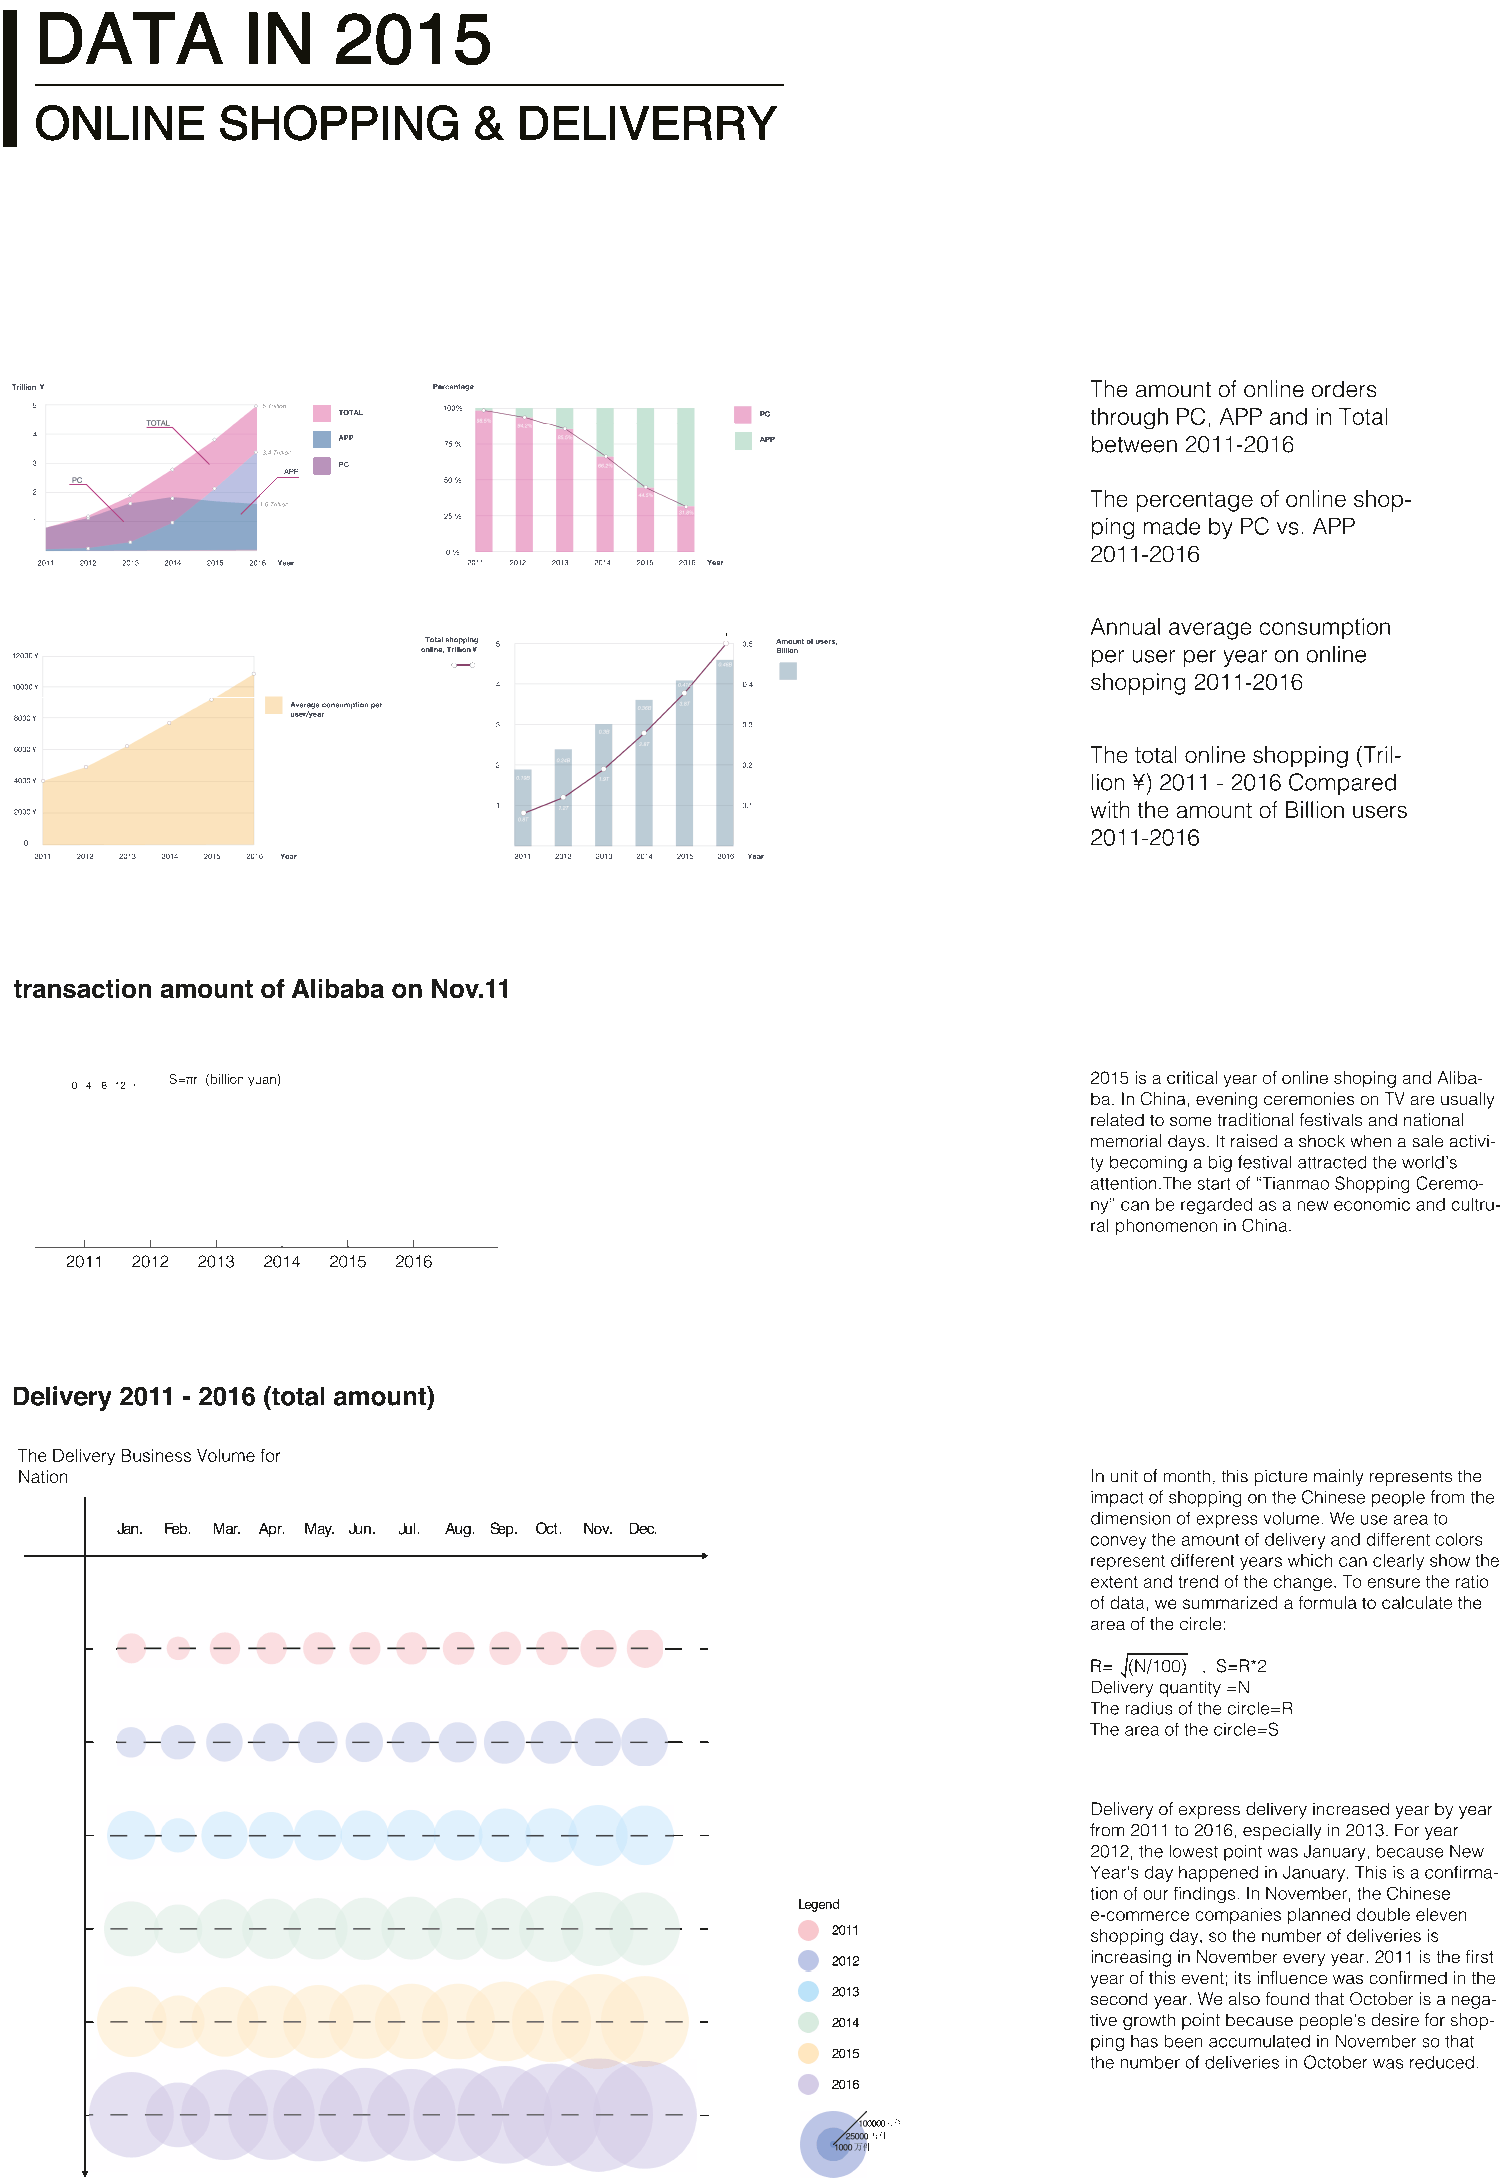
The amount of online orders through PC, APP and in Total between 2011-2016.
Online shopping
In the data story at pp. 6-12 there are some basic statistics over online shopping the last years.
What we learned: 2015 is a critical year of online shoping and Alibaba. In China, evening ceremonies on TV are
usually related to some traditional festivals and national memorial days. It raised a shock when a
sale activity becoming a big festival attracted the world’s attention.The start of “Tianmao Shopping
Ceremony” can be regarded as a new economic and cultrural phonomenon in China.
Delivery 2011 - 2016 (total amount) The transaction on apps overtook the PC in 2015, and has a faster rising speed than the PC. In
2015 Feb is in the bottom, and November is the month which is peaking. These is probalby due to
the spring festival in February and the Douuble 11 in November.
How do we illustrate the data. In unit of month, this picture mainly represents the impact of shopping on the Chinese people
from the dimension of express volume. We use area to convey the amount of delivery and different
colors represent different years which can clearly show the extent and trend of the change. To
ensure the ratio of data, we summarized a formula to calculate the area of the circle:
Delivery quantity =N
The radius of the circle=R
The area of the circle=S
S=R*2
In unit of month, this picture mainly represents the impact of shopping on the Chinese people from the dimension of express volume. We use area to convey the amount of delivery and different colours represent different years which can clearly show the extent and trend of the change. To ensure the ratio of data, we summarised a formula to calculate the area of the circle:
Delivery quantity =N
The radius of the circle=R
The area of the circle=S
What we get from the data. Delivery of express delivery increased year by year from 2011 to 2016, especially in 2013. At the same time, it was the lowest in February and the peak in November. By checking the calendar, we found that the Chinese lunar New Year was just around February, when all the delivery companies were suspended. That’s why the quantity of data decreased. For year 2012, the lowest point was January, because New Year's day happened in January. This is a confirmation of our findings. In November, the Chinese e-commerce companies planned double eleven shopping day, so the number of deliveries is increasing in November every year. 2011 is the first year of this event; its influence was confirmed in the second year. We also found that October is a negative growth point because people's desire for shopping has been accumulated in November so that the number of deliveries in October was reduced.
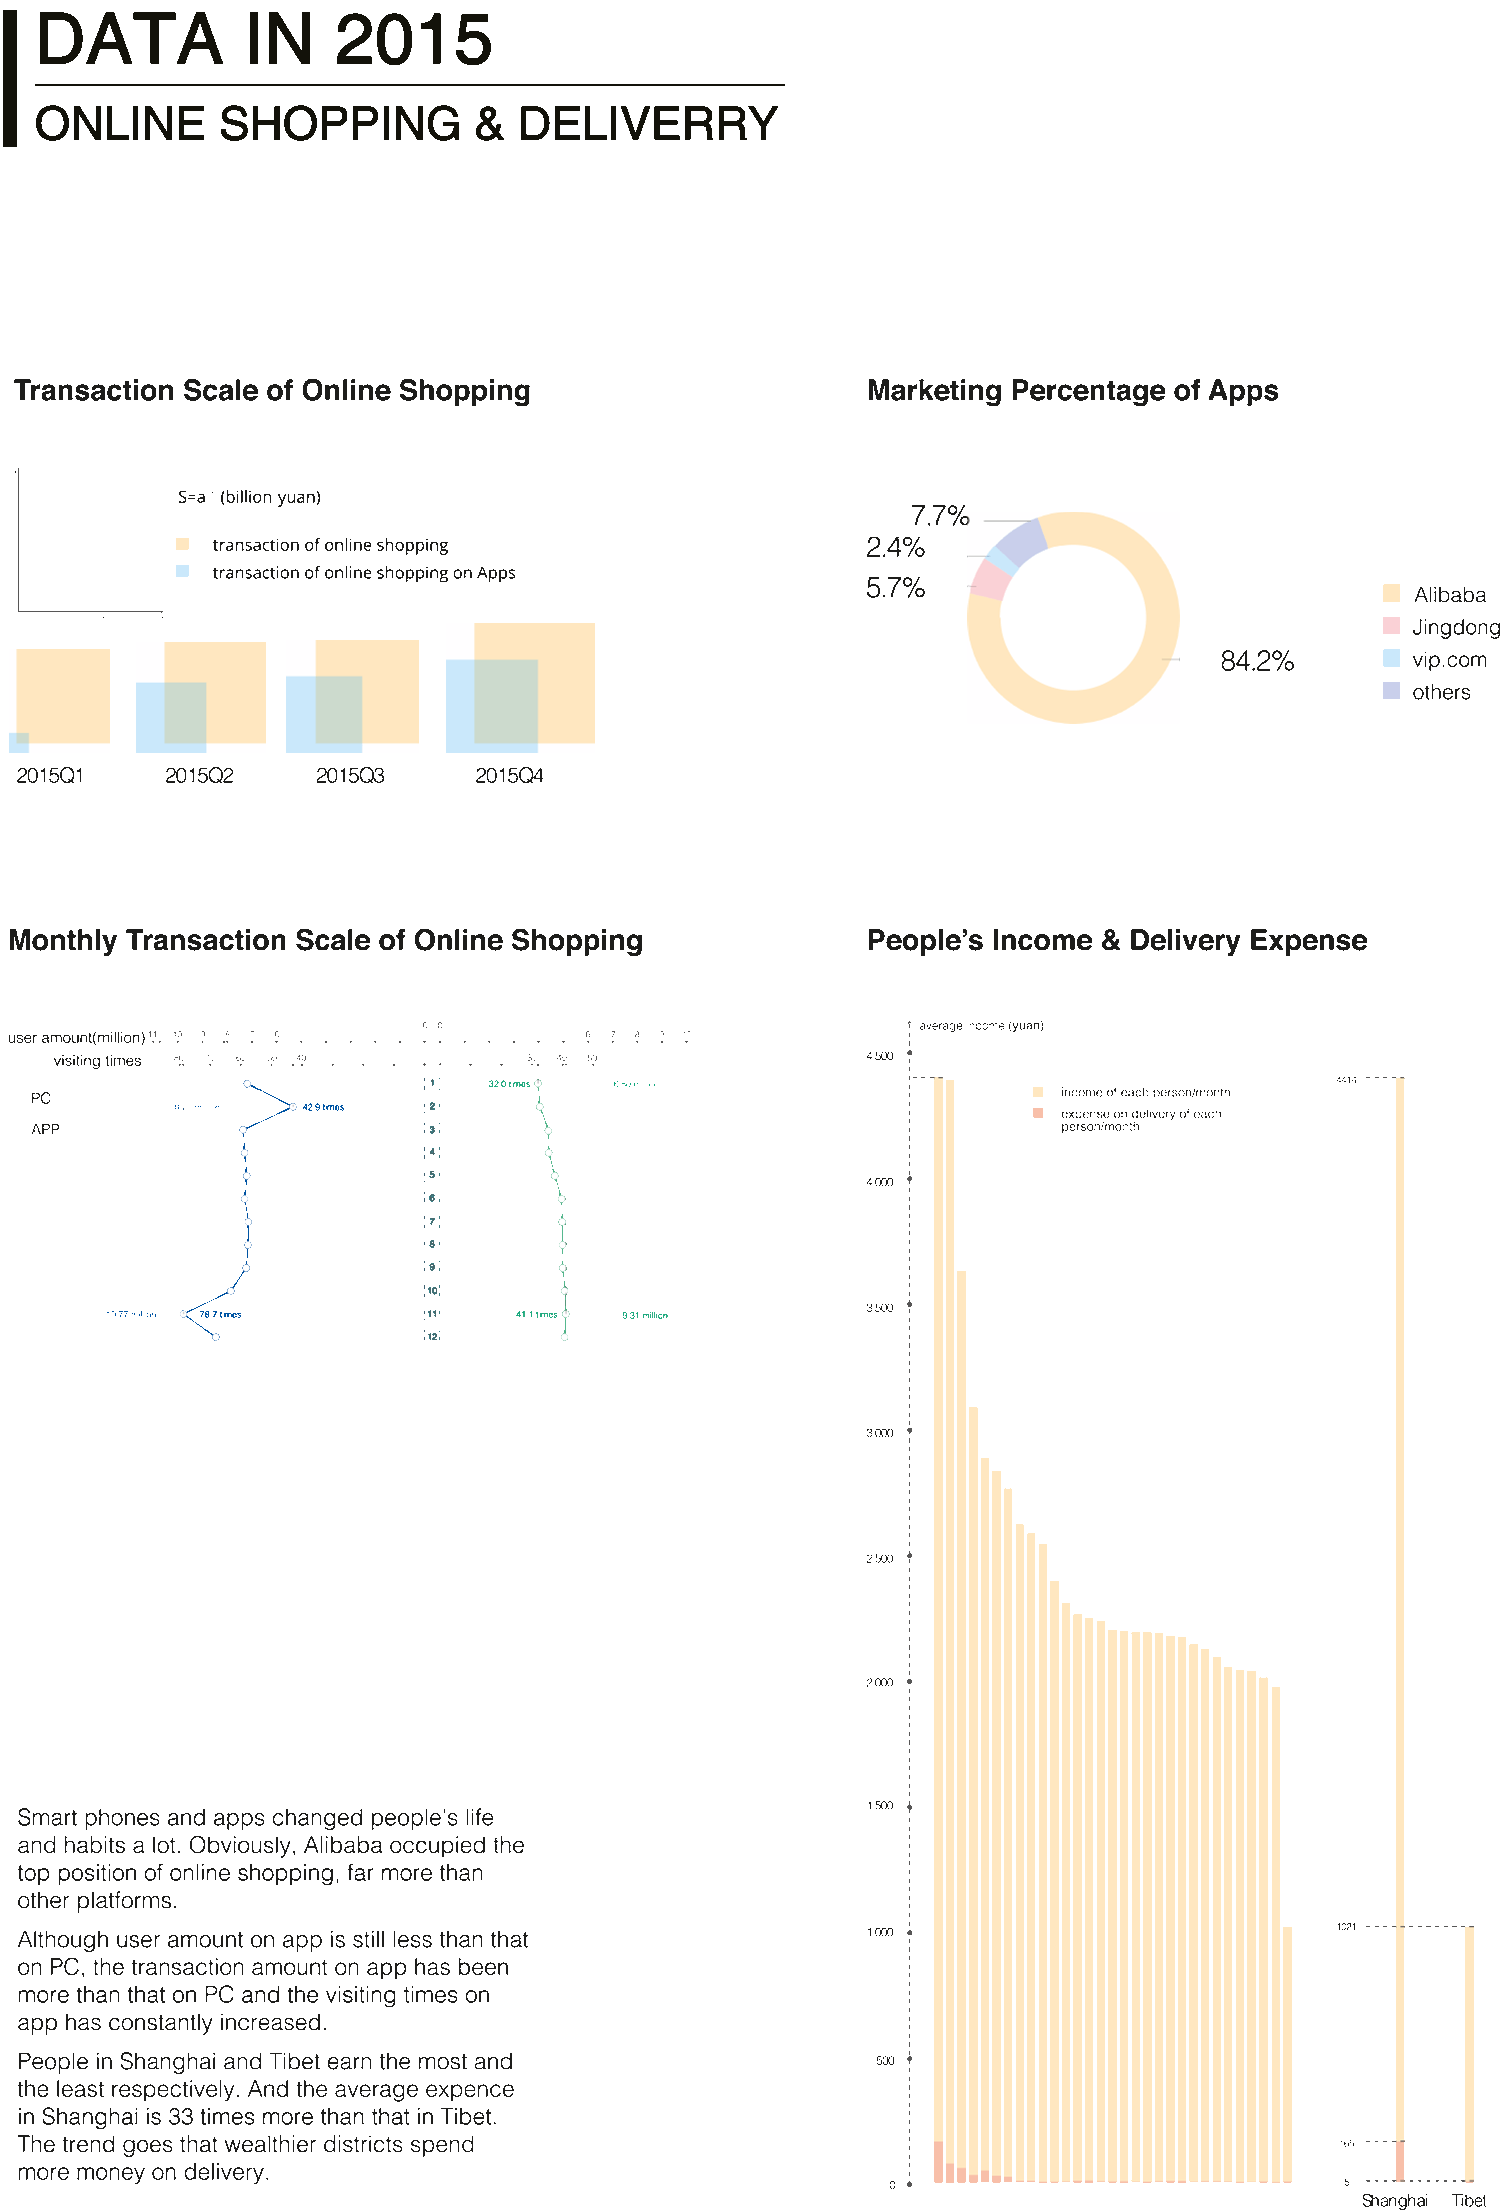
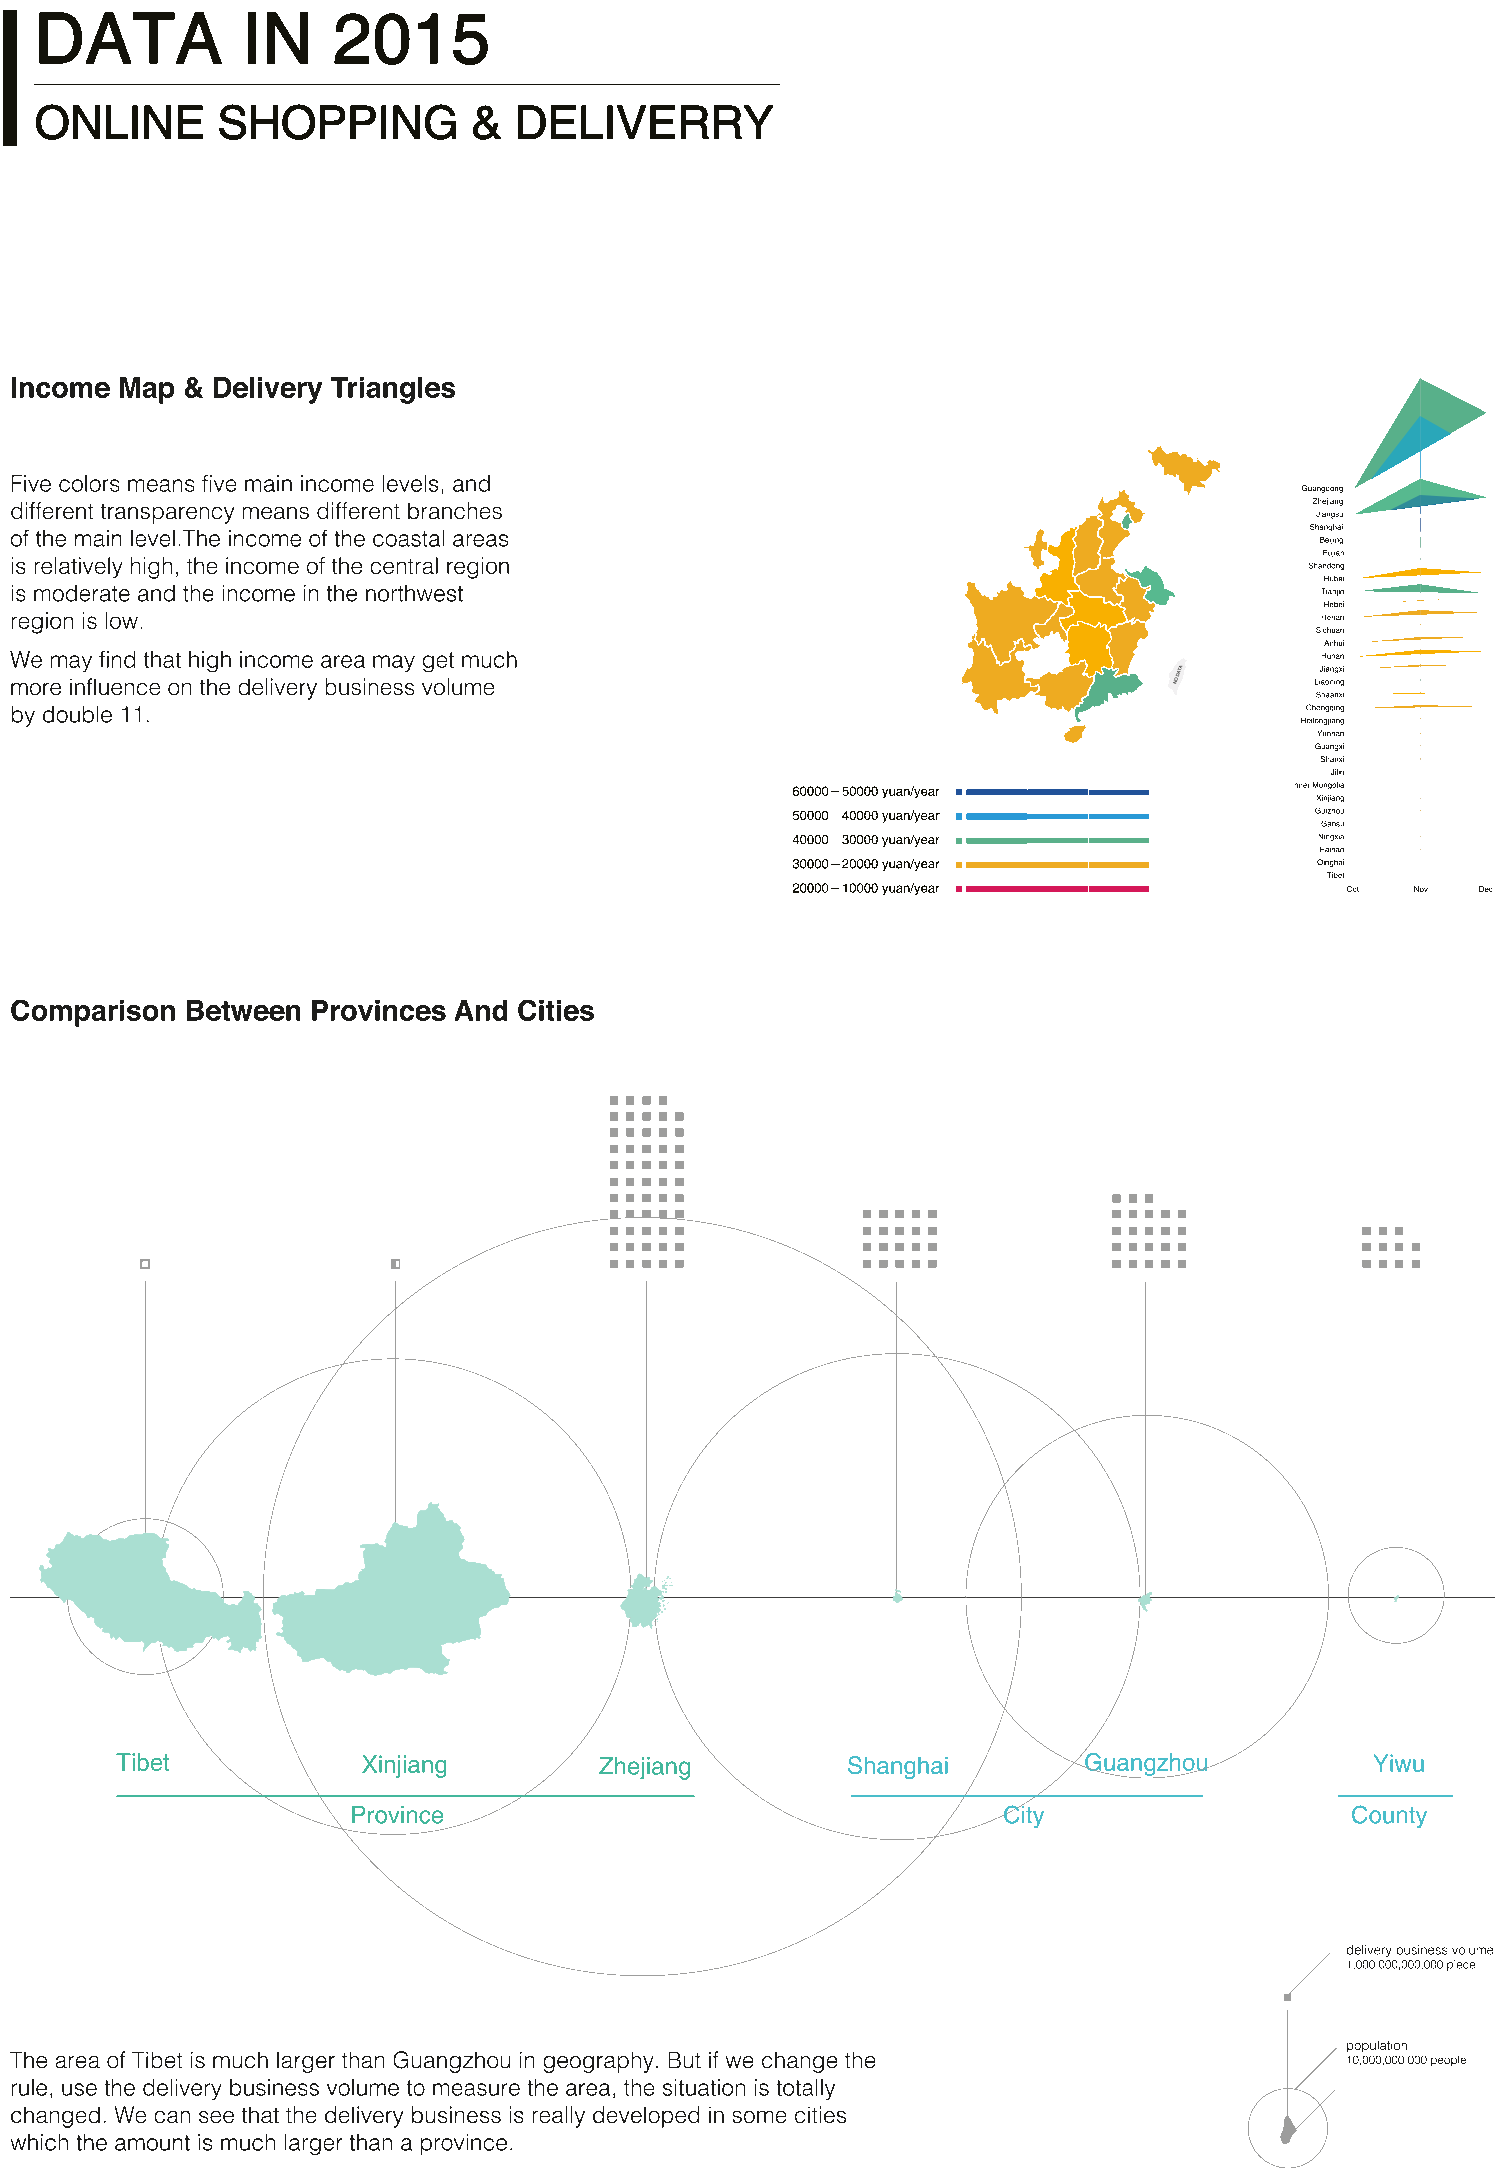
Year 2015 Pages 8-12 dedicated to analysis of last year available dataset about express delivery, including cities comparison and amount of transaction by every quarter. We report some of the charts and we leave to the datastory the detailed analysis.
Including charts: Transaction scale of shopping online in 2015 / 2015 marketing percentage of online shopping apps / Transaction scale of shopping online in 2015 / The comparison between a province and a city / Income map by region and province / People’s income & delivery expense in 2015
Please check below our final visualizations in poster format


Project by Deng Qing | Zheng Rengsi | Shen Wen | Helena Stening | Xu Xin
back to top